Arafatk / Glot
Licence: mit
Glot is a plotting library for Golang built on top of gnuplot.
Stars: ✭ 349
Labels
Projects that are alternatives of or similar to Glot
napari-clusters-plotter
A plugin to use with napari for clustering objects according to their properties.
Stars: ✭ 18 (-94.84%)
Mutual labels: plotting
geneview
Genomics data visualization in Python by using matplotlib.
Stars: ✭ 38 (-89.11%)
Mutual labels: plotting
Matplotlib Venn
Area-weighted venn-diagrams for Python/matplotlib
Stars: ✭ 260 (-25.5%)
Mutual labels: plotting
sr graph
A simple, one-file, header-only, C++ utility for graphs, curves and histograms.
Stars: ✭ 67 (-80.8%)
Mutual labels: plotting
Geoviews
Simple, concise geographical visualization in Python
Stars: ✭ 338 (-3.15%)
Mutual labels: plotting
microfilm
Creating figures and animations for multi-channel images with a focus on microscopy.
Stars: ✭ 22 (-93.7%)
Mutual labels: plotting
Chartify
Python library that makes it easy for data scientists to create charts.
Stars: ✭ 3,054 (+775.07%)
Mutual labels: plotting
spacegrids
Analyze spatial Netcdf data: "Numpy on grids" (Python module)
Stars: ✭ 14 (-95.99%)
Mutual labels: plotting
pyjuque
⚡ Open Source Algorithmic Trading Bot for Python.
Stars: ✭ 318 (-8.88%)
Mutual labels: plotting
Micromathematics
microMathematics Plus - Extended visual calculator
Stars: ✭ 263 (-24.64%)
Mutual labels: plotting
EEGEdu
Interactive Brain Playground - Browser based tutorials on EEG with webbluetooth and muse
Stars: ✭ 91 (-73.93%)
Mutual labels: plotting
AlphaPlot
📈 Application for statistical analysis and data visualization which can generate different types of publication quality 2D and 3D plots with extensive visual customization.
Stars: ✭ 140 (-59.89%)
Mutual labels: plotting
pyrealtime
Realtime data processing and plotting pipelines in Python
Stars: ✭ 62 (-82.23%)
Mutual labels: plotting


![]()
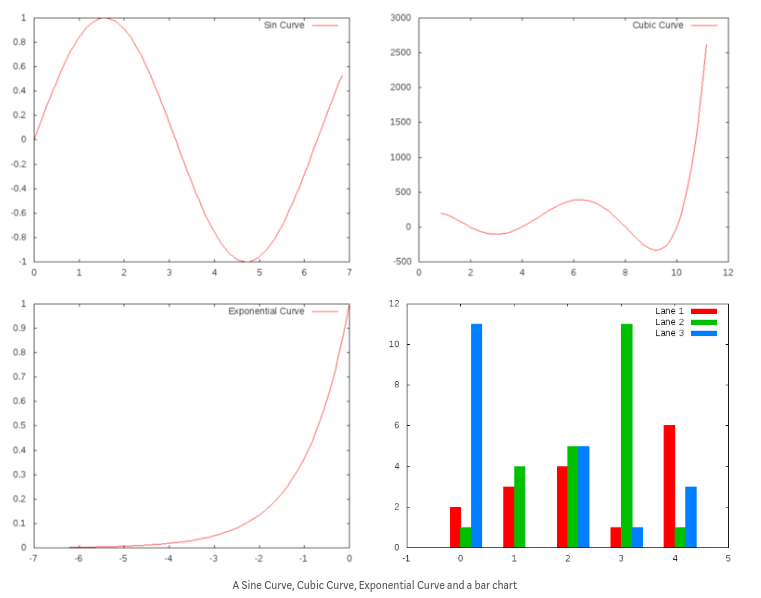
Glot
glot is a plotting library for Golang built on top of gnuplot. glot currently supports styles like lines, points, bars, steps, histogram, circle, and many others. We are continuously making efforts to add more features.
Documentation
Documentation is available at godoc.
Requirements
- gnu plot
- build gnu plot from source
- linux users
sudo apt-get updatesudo apt-get install gnuplot-x11
- mac users
- install homebrew
-
brew cask install xquartz(for x-11) brew install gnuplot --with-x11
Installation
go get github.com/Arafatk/glot
Usage and Examples
We have a blog post explaining our vision and covering some basic usage of the glot library. Check it out here.
Examples
Contributing
We really encourage developers coming in, finding a bug or requesting a new feature. Want to tell us about the feature you just implemented, just raise a pull request and we'll be happy to go through it. Please read the CONTRIBUTING and CODE_OF_CONDUCT file.
Note that the project description data, including the texts, logos, images, and/or trademarks,
for each open source project belongs to its rightful owner.
If you wish to add or remove any projects, please contact us at [email protected].