Graphsignal: AI Application Monitoring
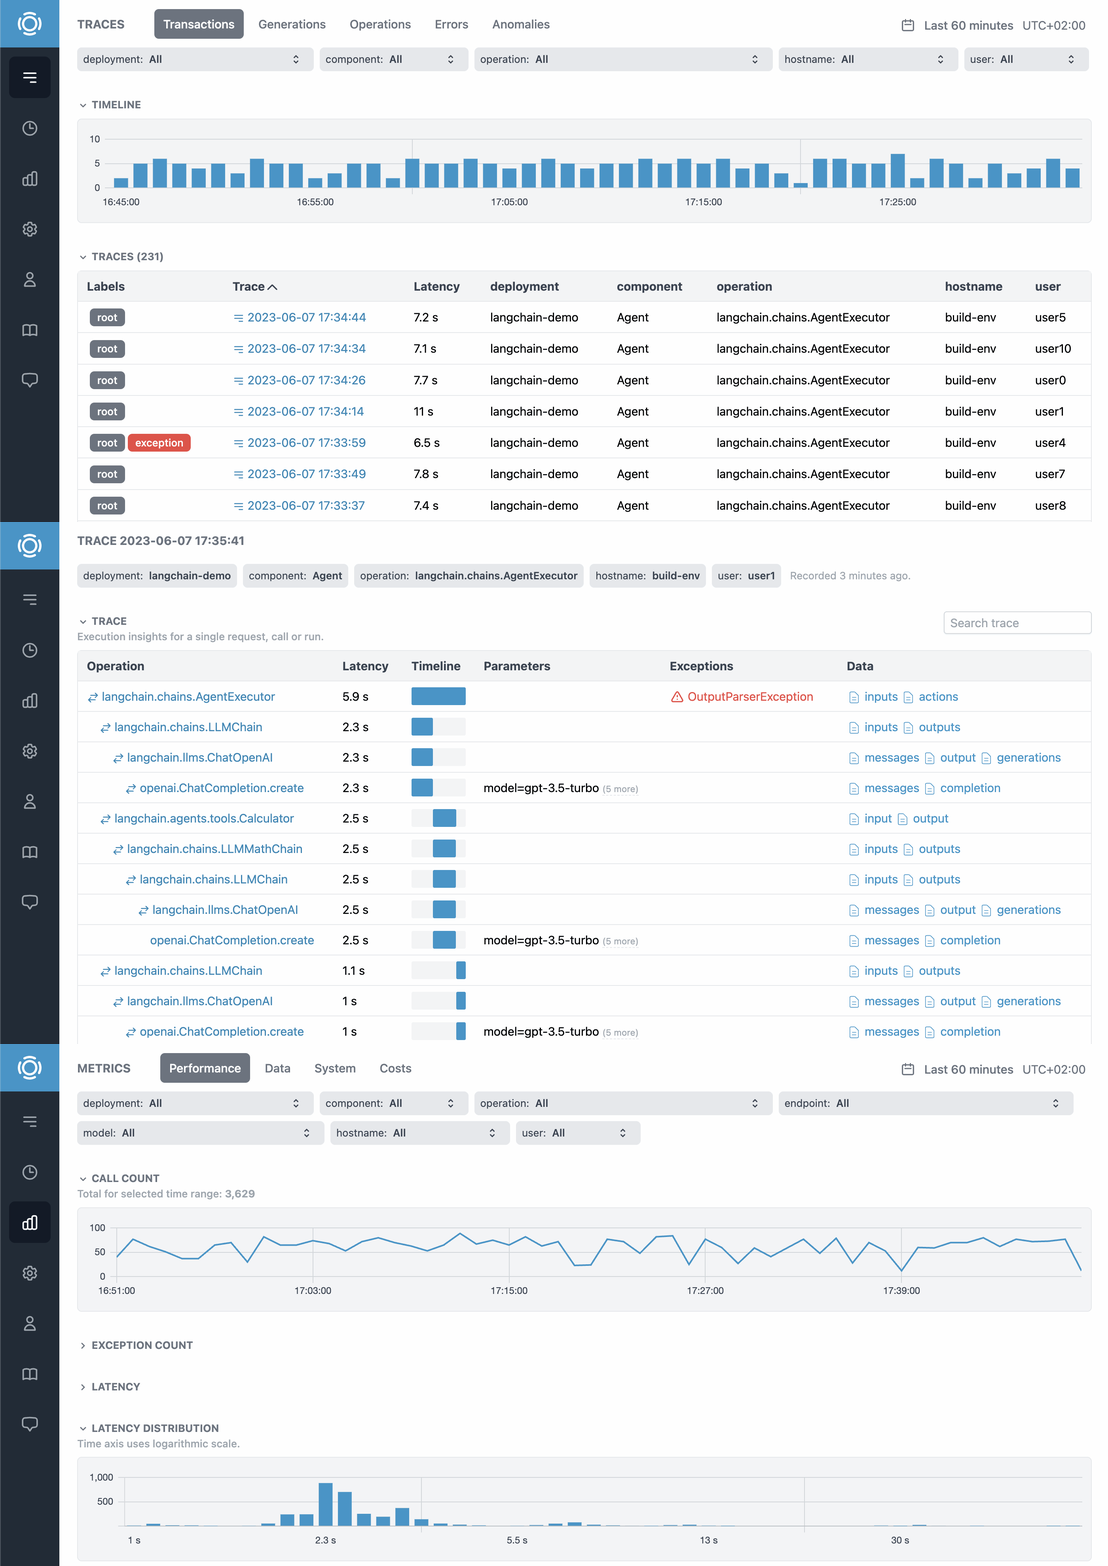
Graphsignal is an observability platform for AI applications that use LLMs or other models. It helps engineers make AI applications faster, reliable and more efficient by monitoring and analyzing performance, resources, data, errors and costs.
- Monitor and analyze inference latency, throughput and resource utilization.
- Track GPU utilization in the context of inference.
- Get notified about errors and anomalies with full machine learning context.
- Monitor data to detect data issues and silent failures.
- Analyze model API costs for deployments, models and any custom tags.
Learn more at graphsignal.com.
Install
Install Graphsignal agent by running:
pip install graphsignal
Or clone and install the GitHub repository:
git clone https://github.com/graphsignal/graphsignal-python.git
python setup.py install
Configure
Configure Graphsignal agent by specifying your API key directly or via GRAPHSIGNAL_API_KEY environment variable.
import graphsignal

graphsignal.configure(api_key='my-api-key', deployment='my-model-prod-v1')
To get an API key, sign up for a free account at graphsignal.com. The key can then be found in your account's Settings / API Keys page.
To track deployments, versions and environments separately, specify a deployment parameter or environment variable GRAPHSIGNAL_DEPLOYMENT.
Integrate
Use the following examples to integrate Graphsignal agent into your machine learning application. See integration documentation and API reference for full reference. More integration examples are available in examples repo.
Monitoring and tracing
Graphsignal auto-instruments and traces libraries and frameworks, such as OpenAI, LangChain, and many others.
To measure and monitor any other executions, e.g. model inference or inference API calls, wrap the code with start_trace method or use trace_function decorator.
with graphsignal.start_trace(endpoint='predict'):
pred = model(x)@graphsignal.trace_function
def predict(x):
return model(x)Enable profiling to additionally record code-level statistics. Profiling is disabled by default due to potential overhead. To enable, provide TraceOptions object.
with graphsignal.start_trace(
        endpoint='predict',
        options=graphsignal.TraceOptions(enable_profiling=True)):
    pred = model(x)
The agent will automatically choose a profiler depending on available modules. Currently, CProfile, PyTorch Kineto and Yappi are supported. The Kineto profiler is used if torch module is detected and Yappi profiler is used if yappi module is detected. Otherwise, CProfile is used. To properly profile asyncio coroutines, just pip install yappi.
Exception tracking
For auto-instrumented libraries, or when using trace_function decorator, start_trace method with with context manager or callbacks, exceptions are automatically recorded. For other cases, use Trace.set_exception method.
Data monitoring
Data is automatically monitored for auto-instrumented libraries. To track data metrics and record data profiles for other cases, Trace.set_data method can be used.
with graphsignal.start_trace(endpoint='predict') as trace:
    trace.set_data('input', input_data)
The following data types are currently supported: list, dict, set, tuple, str, bytes, numpy.ndarray, tensorflow.Tensor, torch.Tensor.
Raw data samples, such as prompts or completions, are recorded by default. To disable, set record_data_samples=False in graphsignal.configure. Note, that data statistics, such as size, shape or number of missing values will still be recorded.
Observe
After everything is setup, log in to Graphsignal to monitor and analyze execution performance and monitor for issues.
Overhead
Graphsignal agent is very lightweight. While all traces are monitored, Graphsignal agent only samples and records certain traces, automatically limiting the overhead. The overhead per trace is measured to be less than 100 microseconds.
Security and Privacy
Graphsignal agent can only open outbound connections to agent-api.graphsignal.com and send data, no inbound connections or commands are possible.
Raw data samples, e.g. prompts, are recorded by default. This feature can be disabled at agent initialization time, if necessary.
Troubleshooting
To enable debug logging, add debug_mode=True to configure(). If the debug log doesn't give you any hints on how to fix a problem, please report it to our support team via your account.
In case of connection issues, please make sure outgoing connections to https://agent-api.graphsignal.com are allowed.


