urbica / React Map Gl
Programming Languages
Projects that are alternatives of or similar to React Map Gl
Urbica React Mapbox GL JS
![]()
![]()


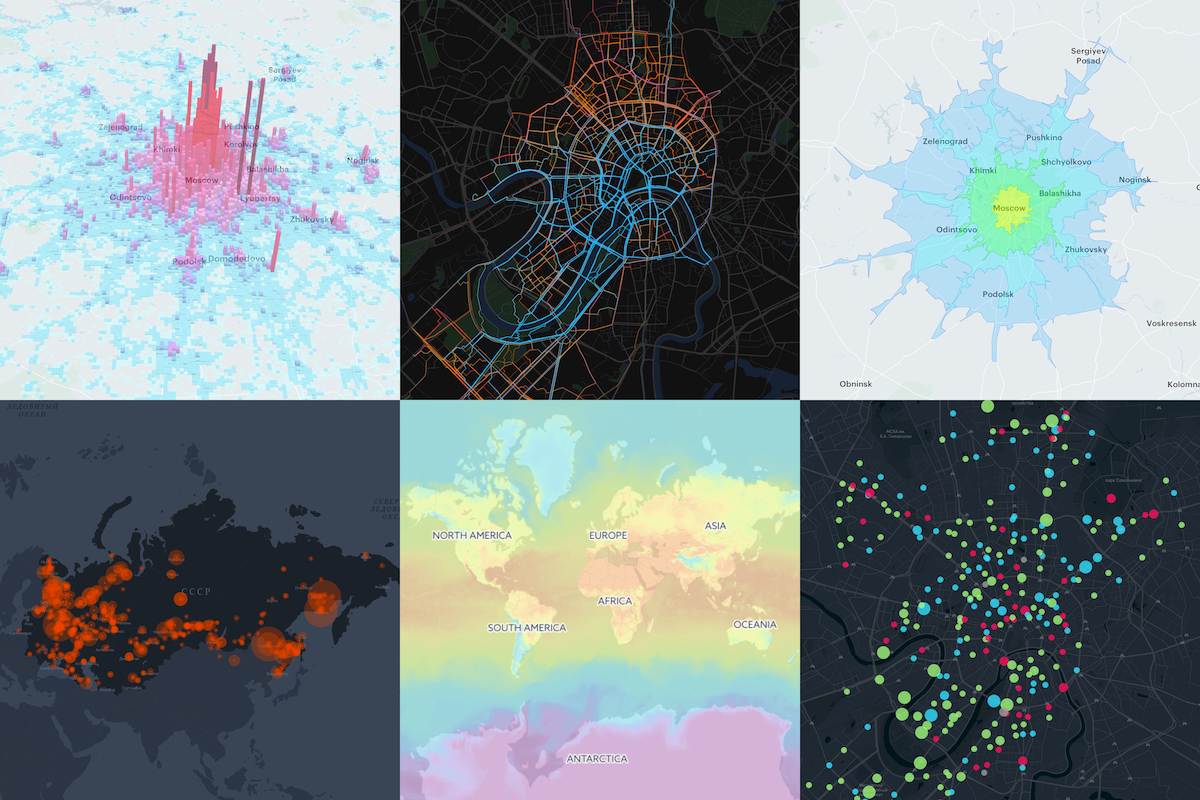
React Component Library for Mapbox GL JS. Mapbox GL JS is a JavaScript library that renders interactive maps from vector tiles and Mapbox styles using WebGL. This project is intended to be as close as possible to the Mapbox GL JS API.
This project is heavily inspired by uber/react-map-gl.
Installation
npm install --save mapbox-gl @urbica/react-map-gl
...or if you are using yarn:
yarn add mapbox-gl @urbica/react-map-gl
Optional Dependencies
If you want to use the LanguageControl:
npm install --save @mapbox/mapbox-gl-language
...or if you are using yarn:
yarn add @mapbox/mapbox-gl-language
Components
| Component | Description |
|---|---|
| MapGL | Represents map on the page |
| MapContext | React Context API for the map instance |
| Source | Sources specify the geographic features to be rendered on the map |
| Layer |
Layers specify the Sources style |
| Filter | Set filter to existing layer |
| CustomLayer | Allow a user to render directly into the map's GL context |
| Image | Adds an image to the map style |
| Popup | React Component for Mapbox GL JS Popup |
| Marker | React Component for Mapbox GL JS Marker |
| FeatureState | Sets the state of a geographic feature rendered on the map |
| AttributionControl | Represents the map's attribution information |
| LanguageControl | Adds support for switching the language of the map style |
| FullscreenControl | Contains a button for toggling the map in and out of fullscreen mode |
| GeolocateControl | Geolocate the user and then track their current location on the map |
| NavigationControl | Contains zoom buttons and a compass |
| ScaleControl | Displays the ratio of a distance on the map to the corresponding distance on the ground |
| Cluster | Cluster Markers with supercluster |
| Draw | Support for drawing and editing features |
Usage
To use any of Mapbox’s tools, APIs, or SDKs, you’ll need a Mapbox access token. Mapbox uses access tokens to associate requests to API resources with your account. You can find all your access tokens, create new ones, or delete existing ones on your API access tokens page.
See Documentation for more examples.
Static Map
By default, MapGL component renders in a static mode. That means that the user cannot interact with the map.
import React from 'react';
import MapGL from '@urbica/react-map-gl';
import 'mapbox-gl/dist/mapbox-gl.css';

<MapGL
  style={{ width: '100%', height: '400px' }}
  mapStyle='mapbox://styles/mapbox/light-v9'
  accessToken={MAPBOX_ACCESS_TOKEN}
  latitude={37.78}
  longitude={-122.41}
  zoom={11}
/>;
Interactive Map
In most cases, you will want the user to interact with the map. To do this, you need to provide onViewportChange handler, that will update map viewport state.
import React, { useState } from 'react';
import MapGL from '@urbica/react-map-gl';
import 'mapbox-gl/dist/mapbox-gl.css';

const [viewport, setViewport] = useState({
  latitude: 37.78,
  longitude: -122.41,
  zoom: 11
});

<MapGL
  style={{ width: '100%', height: '400px' }}
  mapStyle='mapbox://styles/mapbox/light-v9'
  accessToken={MAPBOX_ACCESS_TOKEN}
  latitude={viewport.latitude}
  longitude={viewport.longitude}
  zoom={viewport.zoom}
  onViewportChange={setViewport}
/>;
MapGL with Source and Layer
Sources specify the geographic features to be rendered on the map.
Layers specify the Sources styles. The type of layer is specified by the "type" property, and must be one of background, fill, line, symbol, raster, circle, fill-extrusion, heatmap, hillshade.
Except for layers of the background type, each layer needs to refer to a source. Layers take the data that they get from a source, optionally filter features, and then define how those features are styled.
import React from 'react';
import MapGL, { Source, Layer } from '@urbica/react-map-gl';
import 'mapbox-gl/dist/mapbox-gl.css';

<MapGL
  style={{ width: '100%', height: '400px' }}
  mapStyle='mapbox://styles/mapbox/light-v9'
  accessToken={MAPBOX_ACCESS_TOKEN}
>
  <Source id='contours' type='vector' url='mapbox://mapbox.mapbox-terrain-v2' />
  <Layer
    id='contours'
    type='line'
    source='contours'
    source-layer='contour'
    paint={{
      'line-color': '#877b59',
      'line-width': 1
    }}
  />
</MapGL>;
MapGL with GeoJSON Source
To draw a GeoJSON on a map, add Source with the type property set to geojson and data property set to a URL or inline GeoJSON.
import React, { useState } from 'react';
import MapGL, { Source, Layer } from '@urbica/react-map-gl';
import 'mapbox-gl/dist/mapbox-gl.css';

const [viewport, setViewport] = useState({
  latitude: 37.830348,
  longitude: -122.486052,
  zoom: 15
});

const data = {
  type: 'Feature',
  geometry: {
    type: 'LineString',
    coordinates: [
      [-122.48369693756104, 37.83381888486939],
      [-122.48348236083984, 37.83317489144141],
      [-122.48339653015138, 37.83270036637107],
      [-122.48356819152832, 37.832056363179625],
      [-122.48404026031496, 37.83114119107971],
      [-122.48404026031496, 37.83049717427869],
      [-122.48348236083984, 37.829920943955045],
      [-122.48356819152832, 37.82954808664175],
      [-122.48507022857666, 37.82944639795659],
      [-122.48610019683838, 37.82880236636284],
      [-122.48695850372314, 37.82931081282506],
      [-122.48700141906738, 37.83080223556934],
      [-122.48751640319824, 37.83168351665737],
      [-122.48803138732912, 37.832158048267786],
      [-122.48888969421387, 37.83297152392784],
      [-122.48987674713133, 37.83263257682617],
      [-122.49043464660643, 37.832937629287755],
      [-122.49125003814696, 37.832429207817725],
      [-122.49163627624512, 37.832564787218985],
      [-122.49223709106445, 37.83337825839438],
      [-122.49378204345702, 37.83368330777276]
    ]
  }
};

<MapGL
  style={{ width: '100%', height: '400px' }}
  mapStyle='mapbox://styles/mapbox/light-v9'
  accessToken={MAPBOX_ACCESS_TOKEN}
  onViewportChange={setViewport}
  {...viewport}
>
  <Source id='route' type='geojson' data={data} />
  <Layer
    id='route'
    type='line'
    source='route'
    layout={{
      'line-join': 'round',
      'line-cap': 'round'
    }}
    paint={{
      'line-color': '#888',
      'line-width': 8
    }}
  />
</MapGL>;
Custom Layers support
Custom layers allow a user to render directly into the map's GL context using the map's camera.
Here is an Uber deck.gl usage example.
import React from 'react';
import MapGL, { CustomLayer } from '@urbica/react-map-gl';
import { MapboxLayer } from '@deck.gl/mapbox';
import { ScatterplotLayer } from '@deck.gl/layers';
import 'mapbox-gl/dist/mapbox-gl.css';

const myDeckLayer = new MapboxLayer({
  id: 'my-scatterplot',
  type: ScatterplotLayer,
  data: [{ position: [-74.5, 40], size: 1000 }],
  getPosition: (d) => d.position,
  getRadius: (d) => d.size,
  getColor: [255, 0, 0]
});

<MapGL
  style={{ width: '100%', height: '400px' }}
  mapStyle='mapbox://styles/mapbox/light-v9'
  accessToken={MAPBOX_ACCESS_TOKEN}
  latitude={40}
  longitude={-74.5}
  zoom={9}
>
  <CustomLayer layer={myDeckLayer} />
</MapGL>;
Documentation
Check out documentation website.
Changelog
Check out CHANGELOG.md and releases page.
License
This project is licensed under the terms of the MIT license.
Contributing
Clone and install dependencies
git clone https://github.com/urbica/react-map-gl.git
cd react-map-gl
npm install
Start react-styleguidist server
MAPBOX_ACCESS_TOKEN=<TOKEN> npm start
where <TOKEN> is a valid Mapbox access token.
Run tests with
npm test
Team
 |
 |
 |
|---|---|---|
| Stepan Kuzmin | Artem Boyur | Andrey Bakhvalov |