AdrianAntico / Remixautoml
Programming Languages
Labels
Projects that are alternatives of or similar to Remixautoml


![]()
![]()
![]()

Background
Expand to view content
Automated Machine Learning - In my view, AutoML should consist of functions to help make professional model development and operationalization more efficient. Most ML projects include at least one of the following: data wrangling, feature engineering, feature selection, model development, model evaluation, model interpretation, model optimization, and model operationalization. The functions in this package have been tested across a variety of industries and have consistently out-performd "state of the art" deep learning methods. I've watched coworkers spend months tuning and reconfiguring deep learning models just to have them lose to the functions here, in a matter of a day or two. My recommendation is to first utilize the functions here to establish a legit baseline performance. Then go and test out all the other methods.
Package Details
Supervised Learning - Currently, I'm utilizing CatBoost, XGBoost, and H2O for all of the automated Machine Learning related functions. GPU's can be utilized with CatBoost and XGBoost. Multi-armed bandit grid tuning is available for CatBoost and XGBoost models, which utilize the concept of randomized probability matching, which is detailed in the R pacakge "bandit".
Time series forecasting - Automated functions for single series, panel data, vector autoregression, intermittent demand, and cohort panel data. The panel data models utilize the machine learning algos from above and the feature engineering functions below. They are extremely feature rich and the combination of all possible feature settings is huge. The models for individual series are fully optimized versions from the R package "forecast". I utilize the multi-armed bandit grid tuning algo used in the supervised learning models and apply it to the SARIMA and NNETAR models from the forecast package. I also measure performance on hold out data (and training data, or a blend of the two).
Feature Engineering - Some of the feature engineering functions you can only find in this package, such as the
AutoLagRollStats()andAutoLagRollStatsScoring()functions. You could classify the above functions into several buckets: categorical encoding, target encoding, and distributed lag. You can generate any number of discontiguous lags and rolling statistics (mean, sd, skewness, kurtosis, and every 5th percentile) along with time between records and their associated lags and rolling statistics for transactional level data. The function runs extremely fast if you don't utilize rolling stats other than mean (I still usedata.table::frollapply()but the data.table guys admit it isn't optimized like thedata.table::frollmean()function). Furthermore, you can generate all these features by any number of categorical variables and their interactions PLUS you can request those sets of features to be generated for differnt levels of time aggregations such as transactional, hourly, daily, weekly, monthly, quarterly, and yearly, all in one shot (that is, you do not have to run the function repeatedly to generate the features). Lastly, generating these kinds of time series features on the fly for only a subset of records in a data.table (typically for on-demand model scoring) is not an easy task to do correctly and quickly. However, I spent the time to make it run as fast as I could but I am open to suggestions for making it faster (that goes for any of the functions in RemixAutoML).
Data Management - Every function here is written with fully-optimized data.table code so they run blazingly fast and are as memory efficient as possible. The current set of machine learning algorithms were chosen for their ability to work with big data and their ability to outperform other models, as demonstrated across a variety of real world use cases. The focus of the package is quality, not quantity.
Documentation - Each exported function in the package has a help file and can be viewed in your RStudio session, e.g.
?RemixAutoML::ModelDataPrep. Many of them come with examples coded up in the help files (at the bottom) that you can run to get a feel for how to set the parameters. There's also a listing of exported functions by category with code examples at the bottom of this readme. You can also jump into the R folder here to dig into the source code.
Installation
Expand to view content
1. First, install R package dependencies:
XGBoost runs significantly faster with GPU (it's already pretty fast on CPU) but it can be tricky to get installed. The blog below has been shown to be reliable for getting it done. Install XGBoost on Windows for R with GPU Capability
# Install Dependencies----
if(!("remotes" %in% rownames(installed.packages()))) install.packages("remotes"); print("remotes")
if(!("arules" %in% rownames(installed.packages()))) install.packages("arules"); print("arules")
if(!("bit64" %in% rownames(installed.packages()))) install.packages("bit64"); print("bit64")
if(!("caTools" %in% rownames(installed.packages()))) install.packages("caTools"); print("caTools")
if(!("combinat" %in% rownames(install.packages()))) install.packages("combinat"); print("combinat")
if(!("data.table" %in% rownames(installed.packages()))) install.packages("data.table"); print("data.table")
if(!("doParallel" %in% rownames(installed.packages()))) install.packages("doParallel"); print("doParallel")
if(!("e1071" %in% rownames(installed.packages()))) install.packages("e1071"); print("e1071")
if(!("fBasics" %in% rownames(installed.packages()))) install.packages("fBasics"); print("fBasics")
if(!("foreach" %in% rownames(installed.packages()))) install.packages("foreach"); print("foreach")
if(!("forecast" %in% rownames(installed.packages()))) install.packages("forecast"); print("forecast")
if(!("fpp" %in% rownames(installed.packages()))) install.packages("fpp"); print("fpp")
if(!("ggplot2" %in% rownames(installed.packages()))) install.packages("ggplot2"); print("ggplot2")
if(!("gridExtra" %in% rownames(installed.packages()))) install.packages("gridExtra"); print("gridExtra")
if(!("here" %in% rownames(installed.packages()))) install.packages("here"); print("here")
if(!("itertools" %in% rownames(installed.packages()))) install.packages("itertools"); print("itertools")
if(!("lime" %in% rownames(installed.packages()))) install.packages("lime"); print("lime")
if(!("lubridate" %in% rownames(installed.packages()))) install.packages("lubridate"); print("lubridate")
if(!("Matrix" %in% rownames(installed.packages()))) install.packages("Matrix"); print("Matrix")
if(!("MLmetrics" %in% rownames(installed.packages()))) install.packages("MLmetrics"); print("MLmetrics")
if(!("monreg" %in% rownames(installed.packages()))) install.packages("monreg"); print("monreg")
if(!("nortest" %in% rownames(installed.packages()))) install.packages("nortest"); print("nortest")
if(!("RColorBrewer" %in% rownames(installed.packages()))) install.packages("RColorBrewer"); print("RColorBrewer")
if(!("recommenderlab" %in% rownames(installed.packages()))) install.packages("recommenderlab"); print("recommenderlab")
if(!("ROCR" %in% rownames(installed.packages()))) install.packages("ROCR"); print("ROCR")
if(!("pROC" %in% rownames(installed.packages()))) install.packages("pROC"); print("pROC")
if(!("Rfast" %in% rownames(installed.packages()))) install.packages("Rfast"); print("Rfast")
if(!("scatterplot3d" %in% rownames(installed.packages()))) install.packages("scatterplot3d"); print("scatterplot3d")
if(!("stringr" %in% rownames(installed.packages()))) install.packages("stringr"); print("stringr")
if(!("sde" %in% rownames(installed.packages()))) install.packages("sde"); print("sde")
if(!("timeDate" %in% rownames(installed.packages()))) install.packages("timeDate"); print("timeDate")
if(!("tsoutliers" %in% rownames(installed.packages()))) install.packages("tsoutliers"); print("tsoutliers")
if(!("wordcloud" %in% rownames(installed.packages()))) install.packages("wordcloud"); print("wordcloud")
if(!("xgboost" %in% rownames(installed.packages()))) install.packages("xgboost"); print("xgboost")
for (pkg in c("RCurl","jsonlite")) if (! (pkg %in% rownames(installed.packages()))) { install.packages(pkg) }
install.packages("h2o", type = "source", repos = (c("http://h2o-release.s3.amazonaws.com/h2o/latest_stable_R")))
remotes::install_github('catboost/catboost', subdir = 'catboost/R-package')
remotes::install_github('AdrianAntico/RemixAutoML', upgrade = FALSE, dependencies = FALSE, force = TRUE)
Installation Troubleshooting
The most common issue some users are having when trying to install RemixAutoML is the installation of the catboost package dependency. Since catboost is not on CRAN it can only be installed through GitHub. To install catboost without error (and consequently install RemixAutoML without error), try running this line of code first, then restart your R session, then re-run the 2-step installation process above. (Reference):
If you're still having trouble submit an issue and I'll work with you to get it installed.
# Be sure to use the version you want versus what is listed below
options(devtools.install.args = c("--no-multiarch", "--no-test-load"))
install.packages("https://github.com/catboost/catboost/releases/download/v0.17.3/catboost-R-Windows-0.17.3.tgz", repos = NULL, type = "source", INSTALL_opts = c("--no-multiarch", "--no-test-load"))
If you're having still having trouble installing see if the issue below helps out:
Common Workflows
Expand to view content
Supervised Learning
An example workflow with function references
Expand to view content
- Pull in data from your data warehouse (or from wherever) and clean it up
- Run all the applicable feature engineering functions, such as
AutoLagRollStats(),AutoInteraction(),AutoDiffLagN(),AutoWord2VecModeler(),H2OAutoencoder(),CreateCalendarVariables(),CreateHolidayVariables(), etc. - Partition your data with
AutoDataPartition()You can create any number of data sets, supply stratification variables, and you can choose between 'random' splits, 'time' splits, and 'timeseries' splits. The distinction between 'time' and 'timeseries' splits is that 'time' should be used when you aren't directly working with panel data whereas the 'timeseries' split is for panel data (meaning that the number of records for each combination of group variables are identical). 'time' will first sort you data by the date column and then sort by stratification variables, if you provide some, but there is a risk that some group levels won't make it into all of your data sets. - Run
AutoCatBoostRegression()orAutoCatBoostClassifier()orAutoCatBoostMultiClass()with GPU if you have access to one - Run
AutoXGBoostRegression()orAutoXGBoostClassifier()orAutoXGBoostMultiClass()with GPU if you have access to one - Run
AutoH2oGBMRegression()orAutoH2oGBMClassifier()orAutoH2oGBMMultiClass()if you have the patience to wait for a CPU build. - Run
AutoH2oGLMRegression()orAutoH2oGLMClassifier()orAutoH2oGLMMultiClass()if you want to give a generalized linear model a shot. - Run
AutoH2oMLRegression()orAutoH2oMLClassifier()orAutoH2oMLMultiClass()to run H2O's AutoML function inside the RemixAutoML framework. - Run
AutoH2oDRFRegression()orAutoH2oDRFClassifier()orAutoH2oDRFMultiClass()H2O's Distributed Random Forest can take a really long time to build. H2O's documentation has a great explanation for the reason why it takes much longer compared to their GBM algo. - Investigate model performance contained in the output object returned by those functions. You will be able to look at model calibration plots or box plots, ROC plots, partial depence calibration plots or boxplots, model metrics, etc.
- Pick your model of choice and kick off an extended grid tuning and figure out something else to do that week (or run it over the weekend).
- Compare your results with your coworkers results and see what's working and what isn't. Then you can either move on or continue exploring. Bargain with your boss to get more time so you can explore and learn new things.
Forecasting
Single series and panel data using Time Series models or Machine Learning models
Expand to view content
Supply a data.table to run the functions below:
- For single series check out
AutoBanditSarima(),AutoBanditNNet(),AutoTBATS(),AutoETS(),AutoArfima(), orAutoTS()(older function; no longer developing) - For panel data OR single series check out
AutoCatBoostCARMA(),AutoXGBoostCARMA(),AutoH2OCARMA(),AutoCatBoostHurdleCARMAorAutoCatBoostVectorCARMAor build a loop and run functions from (1) - If you have to do any funnel forecasting, check out AutoCatBoostChainLadder(). First you need to structure you data like the help example. When you think you have found a good configuration, set the parameter SaveModelObjects = TRUE. Then you can run the AutoMLChainLadderForecasting().
RemixAutoML Blogs
Expand to view content
The Most Feature Rich ML Forecasting Methods Available
AutoML Frameworks in R & Python
AI for Small to Medium Size Businesses: A Management Take On The Challenges...
Why Machine Learning is more Practical than Econometrics in the Real World
Build Thousands of Automated Demand Forecasts in 15 Minutes Using AutoCatBoostCARMA in R
Automate Your KPI Forecasts With Only 1 Line of R Code Using AutoTS
Companies Are Demanding Model Interpretability. Here’s How To Do It Right
The Easiest Way to Create Thresholds And Improve Your Classification Model

Feature Engineering 

Expand to view content
AutoLagRollStats() and AutoLagRollStatsScoring()
Code Example
# Create fake Panel Data----
Count <- 1L
for(Level in LETTERS) {
  datatemp <- RemixAutoML::FakeDataGenerator(
    Correlation = 0.75,
    N = 25000L,
    ID = 0L,
    ZIP = 0L,
    FactorCount = 0L,
    AddDate = TRUE,
    Classification = FALSE,
    MultiClass = FALSE)
  datatemp[, Factor1 := eval(Level)]
  if(Count == 1L) {
    data <- data.table::copy(datatemp)
  } else {
    data <- data.table::rbindlist(list(data, data.table::copy(datatemp)))
  }
  Count <- Count + 1L
}

# Add scoring records
data <- RemixAutoML::AutoLagRollStats(

  # Data
  data                 = data,
  DateColumn           = "DateTime",
  Targets              = "Adrian",
  HierarchyGroups      = NULL,
  IndependentGroups    = c("Factor1"),
  TimeUnitAgg          = "days",
  TimeGroups           = c("days", "weeks", "months", "quarters"),
  TimeBetween          = NULL,
  TimeUnit             = "days",

  # Services
  RollOnLag1           = TRUE,
  Type                 = "Lag",
  SimpleImpute         = TRUE,

  # Calculated Columns
  Lags                 = list("days" = c(seq(1,5,1)), "weeks" = c(seq(1,3,1)), "months" = c(seq(1,2,1)), "quarters" = c(seq(1,2,1))),
  MA_RollWindows       = list("days" = c(seq(1,5,1)), "weeks" = c(seq(1,3,1)), "months" = c(seq(1,2,1)), "quarters" = c(seq(1,2,1))),
  SD_RollWindows       = NULL,
  Skew_RollWindows     = NULL,
  Kurt_RollWindows     = NULL,
  Quantile_RollWindows = NULL,
  Quantiles_Selected   = NULL,
  Debug                = FALSE)
Code Example
# Create fake Panel Data----
Count <- 1L
for(Level in LETTERS) {
  datatemp <- RemixAutoML::FakeDataGenerator(
    Correlation = 0.75,
    N = 25000L,
    ID = 0L,
    ZIP = 0L,
    FactorCount = 0L,
    AddDate = TRUE,
    Classification = FALSE,
    MultiClass = FALSE)
  datatemp[, Factor1 := eval(Level)]
  if(Count == 1L) {
    data <- data.table::copy(datatemp)
  } else {
    data <- data.table::rbindlist(list(data, data.table::copy(datatemp)))
  }
  Count <- Count + 1L
}

# Create ID columns to know which records to score
data[, ID := .N:1L, by = "Factor1"]
data.table::set(data, i = which(data[["ID"]] == 2L), j = "ID", value = 1L)

# Score records
data <- RemixAutoML::AutoLagRollStatsScoring(

  # Data
  data                 = data,
  RowNumsID            = "ID",
  RowNumsKeep          = 1,
  DateColumn           = "DateTime",
  Targets              = "Adrian",
  HierarchyGroups      = c("Store","Dept"),
  IndependentGroups    = NULL,

  # Services
  TimeBetween          = NULL,
  TimeGroups           = c("days", "weeks", "months"),
  TimeUnit             = "day",
  TimeUnitAgg          = "day",
  RollOnLag1           = TRUE,
  Type                 = "Lag",
  SimpleImpute         = TRUE,

  # Calculated Columns
  Lags                  = list("days" = c(seq(1,5,1)), "weeks" = c(seq(1,3,1)), "months" = c(seq(1,2,1))),
  MA_RollWindows        = list("days" = c(seq(1,5,1)), "weeks" = c(seq(1,3,1)), "months" = c(seq(1,2,1))),
  SD_RollWindows        = list("days" = c(seq(1,5,1)), "weeks" = c(seq(1,3,1)), "months" = c(seq(1,2,1))),
  Skew_RollWindows      = list("days" = c(seq(1,5,1)), "weeks" = c(seq(1,3,1)), "months" = c(seq(1,2,1))),
  Kurt_RollWindows      = list("days" = c(seq(1,5,1)), "weeks" = c(seq(1,3,1)), "months" = c(seq(1,2,1))),
  Quantile_RollWindows  = list("days" = c(seq(1,5,1)), "weeks" = c(seq(1,3,1)), "months" = c(seq(1,2,1))),
  Quantiles_Selected    = c("q5","q10","q95"),
  Debug                 = FALSE)
Function Description
AutoLagRollStats() builds lags and rolling statistics by grouping variables and their interactions along with multiple different time aggregations if selected. Rolling stats include mean, sd, skewness, kurtosis, and the 5th - 95th percentiles. This function was inspired by the distributed lag modeling framework but I wanted to use it for time series analysis as well and really generalize it as much as possible. The beauty of this function is inspired by analyzing whether a baseball player will get a basehit or more in his next at bat. One easy way to get a better idea of the likelihood is to look at his batting average and his career batting average. However, players go into hot streaks and slumps. How do we account for that? Well, in comes the functions here. You look at the batting average over the last N to N+x at bats, for various N and x. I keep going though - I want the same windows for calculating the players standard deviation, skewness, kurtosis, and various quantiles over those time windows. I also want to look at all those measure but by using weekly data - as in, over the last N weeks, pull in those stats too.
AutoLagRollStatsScoring() builds the above features for a partial set of records in a data set. The function is extremely useful as it can compute these feature vectors at a significantly faster rate than the non scoring version which comes in handy for scoring ML models. If you can find a way to make it faster, let me know.
AutoDiffLagN()
Code Example
##############################
# Current minus lag1
##############################

# Create fake data
data <- RemixAutoML::FakeDataGenerator(
  Correlation = 0.70,
  N = 50000,
  ID = 2L,
  FactorCount = 3L,
  AddDate = TRUE,
  ZIP = 0L,
  TimeSeries = FALSE,
  ChainLadderData = FALSE,
  Classification = FALSE,
  MultiClass = FALSE)

# Store Cols to diff
Cols <- names(data)[which(unlist(data[, lapply(.SD, is.numeric)]))]

# Clean data before running AutoDiffLagN
data <- RemixAutoML::ModelDataPrep(
  data = data,
  Impute = FALSE,
  CharToFactor = FALSE,
  FactorToChar = TRUE)

# Run function
data <- RemixAutoML::AutoDiffLagN(
  data,
  DateVariable = "DateTime",
  GroupVariables = c("Factor_1", "Factor_2", "Factor_3"),
  DiffVariables = Cols,
  DiffDateVariables = "DateTime",
  NLag1 = 0,
  NLag2 = 1,
  Sort = TRUE,
  RemoveNA = TRUE)

##############################
# lag1 minus lag3
##############################

# Create fake data
data <- RemixAutoML::FakeDataGenerator(
  Correlation = 0.70,
  N = 50000,
  ID = 2L,
  FactorCount = 3L,
  AddDate = TRUE,
  ZIP = 0L,
  TimeSeries = FALSE,
  ChainLadderData = FALSE,
  Classification = FALSE,
  MultiClass = FALSE)

# Store Cols to diff
Cols <- names(data)[which(unlist(data[, lapply(.SD, is.numeric)]))]

# Clean data before running AutoDiffLagN
data <- RemixAutoML::ModelDataPrep(
  data = data,
  Impute = FALSE,
  CharToFactor = FALSE,
  FactorToChar = TRUE)

# Run function
data <- RemixAutoML::AutoDiffLagN(
  data,
  DateVariable = "DateTime",
  GroupVariables = c("Factor_1", "Factor_2", "Factor_3"),
  DiffVariables = Cols,
  DiffDateVariables = "DateTime",
  NLag1 = 1,
  NLag2 = 3,
  Sort = TRUE,
  RemoveNA = TRUE)
Function Description
AutoDiffLagN() Generate differences for numeric columns and date columns, by groups. You can specify NLag1 = 0 and NLag2 to generate the diffs based on a lag 1 to lag 2 differences for a column, and multiple columns.
AutoInteraction()
Code Example
#########################################
# Feature Engineering for Model Training
#########################################

# Create fake data
data <- RemixAutoML::FakeDataGenerator(
  Correlation = 0.70,
  N = 50000,
  ID = 2L,
  FactorCount = 2L,
  AddDate = TRUE,
  ZIP = 0L,
  TimeSeries = FALSE,
  ChainLadderData = FALSE,
  Classification = FALSE,
  MultiClass = FALSE)

# Print number of columns
print(ncol(data))

# Store names of numeric and integer cols
Cols <-names(data)[c(which(unlist(lapply(data, is.numeric))),
                     which(unlist(lapply(data, is.integer))))]

# Model Training Feature Engineering
system.time(data <- RemixAutoML::AutoInteraction(
  data = data,
  NumericVars = Cols,
  InteractionDepth = 4,
  Center = TRUE,
  Scale = TRUE,
  SkipCols = NULL,
  Scoring = FALSE,
  File = getwd()))

# user  system elapsed
# 0.32    0.22    0.53

# Print number of columns
print(ncol(data))
# 16

########################################
# Feature Engineering for Model Scoring
########################################

# Create fake data
data <- RemixAutoML::FakeDataGenerator(
  Correlation = 0.70,
  N = 50000,
  ID = 2L,
  FactorCount = 2L,
  AddDate = TRUE,
  ZIP = 0L,
  TimeSeries = FALSE,
  ChainLadderData = FALSE,
  Classification = FALSE,
  MultiClass = FALSE)

# Print number of columns
print(ncol(data))
# 16

# Reduce to single row to mock a scoring scenario
data <- data[1L]

# Model Scoring Feature Engineering
system.time(data <- RemixAutoML::AutoInteraction(
  data = data,
  NumericVars = names(data)[
    c(which(unlist(lapply(data, is.numeric))),
      which(unlist(lapply(data, is.integer))))],
  InteractionDepth = 4,
  Center = TRUE,
  Scale = TRUE,
  SkipCols = NULL,
  Scoring = TRUE,
  File = file.path(getwd(), "Standardize.Rdata")))

# user  system elapsed
# 0.19    0.00    0.19

# Print number of columns
print(ncol(data))
# 1095
Function Description
AutoInteraction() will build out any number of interactions you want for numeric variables. You supply a character vector of numeric or integer column names, along with the names of any numeric columns you want to skip (including the interaction column names) and the interactions will be automatically created for you. For example, if you want a 4th degree interaction from 10 numeric columns, you will have 10 C 2, 10 C 3, and 10 C 4 columns created. Now, let's say you build all those features and decide you don't want all 10 features to be included. Remove the feature name from the NumericVars character vector. Now, let's say you modeled all of the interaction features and want to remove the ones will the lowest scores on the variable importance list. Grab the names and run the interaction function again except this time supply those poor performing interaction column names to the SkipCols argument and they will be ignored. Now, if you want to interact any categorical variable with a numeric variable, you'll have to dummify the categorical variable first and then include the level specific dummy variable column names to the NumericVars character vector argument. If you set Center and Scale to TRUE then the interaction multiplication won't create huge numbers.
AutoWord2VecModeler() and AutoWord2VecScoring()
Code Example
# Create fake data
data <- RemixAutoML::FakeDataGenerator(
  Correlation = 0.70,
  N = 1000L,
  ID = 2L,
  FactorCount = 2L,
  AddDate = TRUE,
  AddComment = TRUE,
  ZIP = 2L,
  TimeSeries = FALSE,
  ChainLadderData = FALSE,
  Classification = FALSE,
  MultiClass = FALSE)

# Create Model and Vectors
data <- RemixAutoML::AutoWord2VecModeler(
  data,
  BuildType = "individual",
  stringCol = c("Comment"),
  KeepStringCol = FALSE,
  ModelID = "Model_1",
  model_path = getwd(),
  vects = 10,
  MinWords = 1,
  WindowSize = 1,
  Epochs = 25,
  SaveModel = "standard",
  Threads = max(1,parallel::detectCores()-2),
  MaxMemory = "28G")

# Remove data
rm(data)

# Create fake data for mock scoring
data <- RemixAutoML::FakeDataGenerator(
  Correlation = 0.70,
  N = 1000L,
  ID = 2L,
  FactorCount = 2L,
  AddDate = TRUE,
  AddComment = TRUE,
  ZIP = 2L,
  TimeSeries = FALSE,
  ChainLadderData = FALSE,
  Classification = FALSE,
  MultiClass = FALSE)

# Create vectors for scoring
data <- RemixAutoML::AutoWord2VecScoring(
  data,
  BuildType = "individual",
  ModelObject = NULL,
  ModelID = "Model_1",
  model_path = getwd(),
  stringCol = "Comment",
  KeepStringCol = FALSE,
  H2OStartUp = TRUE,
  H2OShutdown = TRUE,
  Threads = max(1L, parallel::detectCores() - 2L),
  MaxMemory = "28G")
Function Description
AutoWord2VecModeler() generates a specified number of vectors (word2vec) for each column of text data in your data set that you specify and it will save the models if you specify for re-creating them later in a model scoring process. You can choose to build individual models for each column or one model for all your columns. If you need to run several models for groups of text variables you can run the function several times.
AutoWord2VecScoring() this is for generating word2vec vectors for model scoring situations. The function will load the model, create the transformations, and merge them onto the source data.table just like the training version does.
H2OAutoencoder() and H2OAutoencoderScoring()
Code Example
############################
# Training
############################

# Create simulated data
data <- RemixAutoML::FakeDataGenerator(
  Correlation = 0.70,
  N = 1000L,
  ID = 2L,
  FactorCount = 2L,
  AddDate = TRUE,
  AddComment = FALSE,
  ZIP = 2L,
  TimeSeries = FALSE,
  ChainLadderData = FALSE,
  Classification = FALSE,
  MultiClass = FALSE)

# Run algo
Output <- RemixAutoML::H2OAutoencoder(

  # Select the service
  AnomalyDetection = TRUE,
  DimensionReduction = TRUE,

  # Data related args
  data = data,
  ValidationData = NULL,
  Features = names(data)[2L:(ncol(data)-1L)],
  per_feature = FALSE,
  RemoveFeatures = TRUE,
  ModelID = "TestModel",
  model_path = getwd(),

  # H2O Environment
  NThreads = max(1L, parallel::detectCores()-2L),
  MaxMem = "28G",
  H2OStart = TRUE,
  H2OShutdown = TRUE,

  # H2O ML Args
  LayerStructure = NULL,
  ReturnLayer = 4L,
  Activation = "Tanh",
  Epochs = 5L,
  L2 = 0.10,
  ElasticAveraging = TRUE,
  ElasticAveragingMovingRate = 0.90,
  ElasticAveragingRegularization = 0.001)

# Inspect output
data <- Output$Data
Model <- Output$Model

# If ValidationData is not null
ValidationData <- Output$ValidationData

############################
# Scoring
############################

# Create simulated data
data <- RemixAutoML::FakeDataGenerator(
  Correlation = 0.70,
  N = 1000L,
  ID = 2L,
  FactorCount = 2L,
  AddDate = TRUE,
  AddComment = FALSE,
  ZIP = 2L,
  TimeSeries = FALSE,
  ChainLadderData = FALSE,
  Classification = FALSE,
  MultiClass = FALSE)

# Run algo
data <- RemixAutoML::H2OAutoencoderScoring(

  # Select the service
  AnomalyDetection = TRUE,
  DimensionReduction = TRUE,

  # Data related args
  data = data,
  Features = names(data)[2L:ncol(data)],
  RemoveFeatures = TRUE,
  ModelObject = NULL,
  ModelID = "TestModel",
  model_path = getwd(),

  # H2O args
  NThreads = max(1L, parallel::detectCores()-2L),
  MaxMem = "28G",
  H2OStart = TRUE,
  H2OShutdown = TRUE,
  ReturnLayer = 4L,
  per_feature = FALSE)
Function Description
H2OAutoencoder() Use for dimension reduction and anomaly detection
H2OAutoencoderScoring() Use for dimension reduction and anomaly detection scoring
H2OIsolationForest() and H2OIsolationForestScoring()
Code Example
# Create simulated data
data <- RemixAutoML::FakeDataGenerator(
  Correlation = 0.70,
  N = 50000,
  ID = 2L,
  FactorCount = 2L,
  AddDate = TRUE,
  ZIP = 0L,
  TimeSeries = FALSE,
  ChainLadderData = FALSE,
  Classification = FALSE,
  MultiClass = FALSE)

# Run algo
data <- RemixAutoML::H2OIsolationForest(
  data,
  Features = names(data)[2L:ncol(data)],
  IDcols = c("Adrian", "IDcol_1", "IDcol_2"),
  ModelID = "Adrian",
  SavePath = getwd(),
  Threshold = 0.95,
  MaxMem = "28G",
  NThreads = -1,
  NTrees = 100,
  SampleRate = (sqrt(5)-1)/2,
  MaxDepth = 8,
  MinRows = 1,
  ColSampleRate = 1,
  ColSampleRatePerLevel = 1,
  ColSampleRatePerTree = 1,
  CategoricalEncoding = c("AUTO"),
  Debug = TRUE)

# Remove output from data and then score
data[, eval(names(data)[17:ncol(data)]) := NULL]

# Run algo
Outliers <- RemixAutoML::H2OIsolationForestScoring(
  data,
  Features = names(data)[2:ncol(data)],
  IDcols = c("Adrian", "IDcol_1", "IDcol_2"),
  H2OStart = TRUE,
  H2OShutdown = TRUE,
  ModelID = "TestModel",
  SavePath = getwd(),
  Threshold = 0.95,
  MaxMem = "28G",
  NThreads = -1,
  Debug = FALSE)
Function Description
H2OIsolationForecast() Anomaly detection and feature engineering using H2O Isolation Forest. A model is built, your training data is scored, and the model is saved to file for later use in scoring environments with H2OIsolationForestScoring()
H2OIsolationForecastScoring() Scoring function
AutoClustering()
Code Example
#########################
# Training Setup
#########################

# Create fake data
data <- RemixAutoML::FakeDataGenerator(
  Correlation = 0.85,
  N = 1000,
  ID = 2,
  ZIP = 0,
  AddDate = TRUE,
  Classification = FALSE,
  MultiClass = FALSE)

# Run function
data <- RemixAutoML::AutoClustering(
  data,
  FeatureColumns = names(data)[2:(ncol(data)-1)],
  ModelID = "TestModel",
  SavePath = getwd(),
  NThreads = 8,
  MaxMemory = "28G",
  MaxClusters = 50,
  ClusterMetric = "totss",
  RunDimReduction = TRUE,
  ShrinkRate = (sqrt(5) - 1) / 2,
  Epochs = 5L,
  L2_Reg = 0.10,
  ElasticAveraging = TRUE,
  ElasticAveragingMovingRate = 0.90,
  ElasticAveragingRegularization = 0.001)

#########################
# Scoring Setup
#########################

Sys.sleep(10)

# Create fake data
data <- RemixAutoML::FakeDataGenerator(
  Correlation = 0.85,
  N = 1000,
  ID = 2,
  ZIP = 0,
  AddDate = TRUE,
  Classification = FALSE,
  MultiClass = FALSE)

# Run function
data <- RemixAutoML::AutoClusteringScoring(
  data,
  FeatureColumns = names(data)[2:(ncol(data)-1)],
  ModelID = "TestModel",
  SavePath = getwd(),
  NThreads = 8,
  MaxMemory = "28G",
  DimReduction = TRUE)
Function Description
AutoClustering() Generates a single column and merges it onto your data. You can have an autoencoder ran to reduce the dimension size before running the KMeans grid tuning operation. If you provide a directory path, the models will be saved and can be used later in scoring enviroments. I find that I utilize clustering more often for feature engineering that unsupervised learning which is why I put the code example and description here. The function utilizes H2O under the hood with their KMeans algo for the clustering and their deep learning algo for the dimensionality reduction.
CreateCalendarVariables()
Code Example
# Create fake data with a Date column----
data <- RemixAutoML::FakeDataGenerator(
  Correlation = 0.75,
  N = 25000L,
  ID = 2L,
  ZIP = 0L,
  FactorCount = 4L,
  AddDate = TRUE,
  Classification = FALSE,
  MultiClass = FALSE)
for(i in seq_len(20L)) {
  print(i)
  data <- data.table::rbindlist(list(data, RemixAutoML::FakeDataGenerator(
    Correlation = 0.75,
    N = 25000L,
    ID = 2L,
    ZIP = 0L,
    FactorCount = 4L,
    AddDate = TRUE,
    Classification = FALSE,
    MultiClass = FALSE)))
}

# Create calendar variables - automatically excludes the second, minute, and hour selections since
#   it is not timestamp data
runtime <- system.time(
  data <- RemixAutoML::CreateCalendarVariables(
    data = data,
    DateCols = "DateTime",
    AsFactor = FALSE,
    TimeUnits = c("second", "minute", "hour", "wday", "mday", "yday", "week", "isoweek", "wom", "month", "quarter", "year")))
head(data)
print(runtime)
Function Description
CreateCalendarVariables() This functions creates numerical columns based on the date columns you supply such as second, minute, hour, week day, day of month, day of year, week, isoweek, wom, month, quarter, and year.
CreateHolidayVariable()
Code Example
# Create fake data with a Date----
data <- RemixAutoML::FakeDataGenerator(
  Correlation = 0.75,
  N = 25000L,
  ID = 2L,
  ZIP = 0L,
  FactorCount = 4L,
  AddDate = TRUE,
  Classification = FALSE,
  MultiClass = FALSE)
for(i in seq_len(20L)) {
  print(i)
  data <- data.table::rbindlist(list(data, RemixAutoML::FakeDataGenerator(
    Correlation = 0.75,
    N = 25000L,
    ID = 2L,
    ZIP = 0L,
    FactorCount = 4L,
    AddDate = TRUE,
    Classification = FALSE,
    MultiClass = FALSE)))
}
# Run function and time it
runtime <- system.time(
  data <- CreateHolidayVariables(
    data,
    DateCols = "DateTime",
    LookbackDays = 7,
    HolidayGroups = c("USPublicHolidays","EasterGroup","ChristmasGroup","OtherEcclesticalFeasts"),
    Holidays = NULL
    Print = FALSE))
head(data)
print(runtime)
Function Description
CreateHolidayVariable()
This function counts up the number of specified holidays between the current record time stamp and the previous record time stamp, by group as well if specified.
DummifyDT()
Code Example
# Create fake data with 10 categorical columns
data <- RemixAutoML::FakeDataGenerator(
  Correlation = 0.85,
  N = 25000,
  ID = 2L,
  ZIP = 0,
  FactorCount = 10L,
  AddDate = FALSE,
  Classification = FALSE,
  MultiClass = FALSE)

# Create dummy variables
data <- DummifyDT(
  data = data,
  cols = c("Factor_1",
           "Factor_2",
           "Factor_3",
           "Factor_4",
           "Factor_5",
           "Factor_6",
           "Factor_8",
           "Factor_9",
           "Factor_10"),
  TopN = c(rep(3,9)),
  KeepFactorCols = TRUE,
  OneHot = FALSE,
  SaveFactorLevels = TRUE,
  SavePath = getwd(),
  ImportFactorLevels = FALSE,
  FactorLevelsList = NULL,
  ClustScore = FALSE,
  ReturnFactorLevels = FALSE)

# Create Fake Data for Scoring Replication
data <- RemixAutoML::FakeDataGenerator(
  Correlation = 0.85,
  N = 25000,
  ID = 2L,
  ZIP = 0,
  FactorCount = 10L,
  AddDate = FALSE,
  Classification = FALSE,
  MultiClass = FALSE)

# Scoring Version (imports csv's to generate matching levels and ordering)
data <- RemixAutoML::DummifyDT(
  data = data,
  cols = c("Factor_1",
           "Factor_2",
           "Factor_3",
           "Factor_4",
           "Factor_5",
           "Factor_6",
           "Factor_8",
           "Factor_9",
           "Factor_10"),
  TopN = c(rep(3,9)),
  KeepFactorCols = TRUE,
  OneHot = FALSE,
  SaveFactorLevels = TRUE,
  SavePath = getwd(),
  ImportFactorLevels = TRUE,
  FactorLevelsList = NULL,
  ClustScore = FALSE,
  ReturnFactorLevels = FALSE)
Function Description
DummifyDT() This function is used in the AutoXGBoost__() suite of modeling functions to manage categorical variables in your training, validation, and test sets. This function rapidly dichotomizes categorical columns in a data.table (N+1 columns for N levels using one hot encoding or N columns for N levels otherwise). Several other arguments exist for outputting and saving factor levels. This is useful in model training, validating, and scoring processes.
AutoDataPartition()
Code Example
# Create fake data
data <- RemixAutoML::FakeDataGenerator(
  Correlation = 0.85,
  N = 1000,
  ID = 2,
  ZIP = 0,
  AddDate = FALSE,
  Classification = FALSE,
  MultiClass = FALSE)

# Run data partitioning function
dataSets <- RemixAutoML::AutoDataPartition(
  data,
  NumDataSets = 3L,
  Ratios = c(0.70,0.20,0.10),
  PartitionType = "random",
  StratifyColumnNames = NULL,
  TimeColumnName = NULL)

# Collect data
TrainData <- dataSets$TrainData
ValidationData <- dataSets$ValidationData
TestData <- dataSets$TestData
Function Description
AutoDataPartition() is designed to achieve a few things that standard data partitioning processes or functions don't handle. First, you can choose to build any number of partitioned data sets beyond the standard train, validate, and test data sets. Second, you can choose between random sampling to split your data or you can choose a time-based partitioning. Third, for the random partitioning, you can specify a stratification columns in your data to stratify by in order to ensure a proper split amongst your categorical features (E.g. think MultiClass targets). Lastly, it's 100% data.table so it will run fast and with low memory overhead.
ModelDataPrep()
Code Example
# Create fake data
data <- RemixAutoML::FakeDataGenerator(
  Correlation = 0.75,
  N = 250000L,
  ID = 2L,
  ZIP = 0L,
  FactorCount = 6L,
  AddDate = TRUE,
  AddComment = FALSE,
  TimeSeries = FALSE,
  AddDate = TRUE,
  Classification = FALSE,
  MultiClass = FALSE)

# Check column types
str(data)

# RUn function
data <- RemixAutoML::ModelDataPrep(
  data,
  Impute = TRUE,
  CharToFactor = FALSE,
  FactorToChar = TRUE,
  IntToNumeric = TRUE,
  LogicalToBinary = FALSE,
  DateToChar = FALSE,
  RemoveDates = TRUE,
  MissFactor = "0",
  MissNum = -1,
  IgnoreCols = c("Factor_1"))

# Check column types
str(data)
Function Description
ModelDataPrep() This function will loop through every column in your data and apply a variety of functions based on argument settings. For all columns not ignored, these tasks include:
- Character type to Factor type converstion
- Factor type to Character type conversion
- Constant value imputation for numeric and categorical columns
- Integer type to Numeric type conversion
- Date type to Character type conversion
- Remove date columns
- Ignore specified columns
AutoTransformationCreate() and AutoTransformationScore()
Function Description
AutoTransformationCreate() is a function for automatically identifying the optimal transformations for numeric features and transforming them once identified. This function will loop through your selected transformation options (YeoJohnson, BoxCox, Asinh, Log, LogPlus1, Sqrt, along with Asin and Logit for proportion data) and find the one that produces the best fit to a normal distribution. It then generates the transformation and collects the metadata information for use in the AutoTransformationScore() function, either by returning the objects or saving them to file.
AutoTransformationScore() is a the compliment function to AutoTransformationCreate(). Automatically apply or inverse the transformations you identified in AutoTransformationCreate() to other data sets. This is useful for applying transformations to your validation and test data sets for modeling, which is done automatically for you if you specify.
AutoHierarchicalFourier()
Function Description
AutoHierarchicalFourier() turns time series data into fourier series. This function can generate any number of fourier pairs the user wants (if they can actually build) and you can run it with grouped time series data. In the grouping case, fourier pairs can be created for each categorical variable along with the full interactions between specified categoricals. The process is parallelized as well to run as fast as possible.
Supervised Learning 

Expand to view content
Regression
click to expand
AutoCatBoostRegression() GPU Capable
AutoCatBoostRegression() utilizes the CatBoost algorithm in the below steps
Code Example
# Create some dummy correlated data
data <- RemixAutoML::FakeDataGenerator(
 Correlation = 0.85,
 N = 10000,
 ID = 2,
 ZIP = 0,
 AddDate = FALSE,
 Classification = FALSE,
 MultiClass = FALSE)

# Run function
TestModel <- RemixAutoML::AutoCatBoostRegression(

 # GPU or CPU and the number of available GPUs
 task_type = "GPU",
 NumGPUs = 1,

 # Metadata args
 ModelID = "Test_Model_1",
 model_path = normalizePath("./"),
 metadata_path = normalizePath("./"),
 SaveModelObjects = FALSE,
 SaveInfoToPDF = FALSE,
 ReturnModelObjects = TRUE,

 # Data args
 data = data,
 TrainOnFull = FALSE,
 ValidationData = NULL,
 TestData = NULL,
 Weights = NULL,
 TargetColumnName = "Adrian",
 FeatureColNames = names(data)[!names(data) %in%
   c("IDcol_1", "IDcol_2","Adrian")],
 PrimaryDateColumn = NULL,
 DummifyCols = FALSE,
 IDcols = c("IDcol_1","IDcol_2"),
 TransformNumericColumns = "Adrian",
 Methods = c("BoxCox", "Asinh", "Asin", "Log",
   "LogPlus1", "Sqrt", "Logit"),

 # Model evaluation
 eval_metric = "RMSE",
 eval_metric_value = 1.5,
 loss_function = "RMSE",
 loss_function_value = 1.5,
 MetricPeriods = 10L,
 NumOfParDepPlots = ncol(data)-1L-2L,
 EvalPlots = TRUE,

 # Grid tuning args
 PassInGrid = NULL,
 GridTune = FALSE,
 MaxModelsInGrid = 30L,
 MaxRunsWithoutNewWinner = 20L,
 MaxRunMinutes = 60*60,
 Shuffles = 4L,
 BaselineComparison = "default",

 # ML args
 langevin = FALSE,
 diffusion_temperature = 10000,
 Trees = 1000,
 Depth = 6,
 L2_Leaf_Reg = 3.0,
 RandomStrength = 1,
 BorderCount = 128,
 LearningRate = NULL,
 RSM = 1,
 BootStrapType = NULL,
 GrowPolicy = "SymmetricTree",
 model_size_reg = 0.5,
 feature_border_type = "GreedyLogSum",
 sampling_unit = "Object",
 subsample = NULL,
 score_function = "Cosine",
 min_data_in_leaf = 1,
 DebugMode = FALSE)


# Output
TestModel$Model
TestModel$ValidationData
TestModel$EvaluationPlot
TestModel$EvaluationBoxPlot
TestModel$EvaluationMetrics
TestModel$VariableImportance
TestModel$InteractionImportance
TestModel$ShapValuesDT
TestModel$VI_Plot
TestModel$PartialDependencePlots
TestModel$PartialDependenceBoxPlots
TestModel$GridList
TestModel$ColNames
TestModel$TransformationResults
AutoXGBoostRegression() GPU Capable
AutoXGBoostRegression() utilizes the XGBoost algorithm in the below steps
Code Example
# Create some dummy correlated data
data <- RemixAutoML::FakeDataGenerator(
  Correlation = 0.85,
  N = 1000,
  ID = 2,
  ZIP = 0,
  AddDate = FALSE,
  Classification = FALSE,
  MultiClass = FALSE)

# Run function
TestModel <- RemixAutoML::AutoXGBoostRegression(

  # GPU or CPU
  TreeMethod = "hist",
  NThreads = parallel::detectCores(),
  LossFunction = 'reg:squarederror',

  # Metadata args
  model_path = normalizePath("./"),
  metadata_path = NULL,
  ModelID = "Test_Model_1",
  ReturnFactorLevels = TRUE,
  ReturnModelObjects = TRUE,
  SaveModelObjects = FALSE,

  # Data args
  data = data,
  TrainOnFull = FALSE,
  ValidationData = NULL,
  TestData = NULL,
  TargetColumnName = "Adrian",
  FeatureColNames = names(data)[!names(data) %in%
                                  c("IDcol_1", "IDcol_2","Adrian")],
  IDcols = c("IDcol_1","IDcol_2"),
  TransformNumericColumns = NULL,
  Methods = c("BoxCox", "Asinh", "Asin", "Log",
              "LogPlus1", "Sqrt", "Logit", "YeoJohnson"),

  # Model evaluation args
  eval_metric = "rmse",
  NumOfParDepPlots = 3L,

  # Grid tuning args
  PassInGrid = NULL,
  GridTune = FALSE,
  grid_eval_metric = "mse",
  BaselineComparison = "default",
  MaxModelsInGrid = 10L,
  MaxRunsWithoutNewWinner = 20L,
  MaxRunMinutes = 24L*60L,
  Verbose = 1L,

  # ML args
  Shuffles = 1L,
  Trees = 50L,
  eta = 0.05,
  max_depth = 4L,
  min_child_weight = 1.0,
  subsample = 0.55,
  colsample_bytree = 0.55)
AutoH2oGBMRegression()
AutoH2oGBMRegression() utilizes the H2O Gradient Boosting algorithm in the below steps
Code Example
# Create some dummy correlated data
data <- RemixAutoML::FakeDataGenerator(
  Correlation = 0.85,
  N = 1000,
  ID = 2,
  ZIP = 0,
  AddDate = FALSE,
  Classification = FALSE,
  MultiClass = FALSE)

# Run function
TestModel <- RemixAutoML::AutoH2oGBMRegression(

  # Compute management
  MaxMem = {gc();paste0(as.character(floor(as.numeric(system("awk '/MemFree/ {print $2}' /proc/meminfo", intern=TRUE)) / 1000000)),"G")},
  NThreads = max(1, parallel::detectCores()-2),
  H2OShutdown = TRUE,
  H2OStartUp = TRUE,
  IfSaveModel = "mojo",

  # Model evaluation
  NumOfParDepPlots = 3,

  # Metadata arguments:
  model_path = normalizePath("./"),
  metadata_path = file.path(normalizePath("./")),
  ModelID = "FirstModel",
  ReturnModelObjects = TRUE,
  SaveModelObjects = FALSE,
  SaveInfoToPDF = FALSE,

  # Data arguments
  data = data,
  TrainOnFull = FALSE,
  ValidationData = NULL,
  TestData = NULL,
  TargetColumnName = "Adrian",
  FeatureColNames = names(data)[!names(data) %in% c("IDcol_1", "IDcol_2","Adrian")],
  WeightsColumn = NULL,
  TransformNumericColumns = NULL,
  Methods = c("BoxCox", "Asinh", "Asin", "Log", "LogPlus1", "Sqrt", "Logit","YeoJohnson"),

  # ML grid tuning args
  GridTune = FALSE,
  GridStrategy = "Cartesian",
  MaxRuntimeSecs = 60*60*24,
  StoppingRounds = 10,
  MaxModelsInGrid = 2,

  # Model args
  Trees = 50,
  LearnRate = 0.10,
  LearnRateAnnealing = 1,
  eval_metric = "RMSE",
  Alpha = NULL,
  Distribution = "poisson",
  MaxDepth = 20,
  SampleRate = 0.632,
  ColSampleRate = 1,
  ColSampleRatePerTree = 1,
  ColSampleRatePerTreeLevel  = 1,
  MinRows = 1,
  NBins = 20,
  NBinsCats = 1024,
  NBinsTopLevel = 1024,
  HistogramType = "AUTO",
  CategoricalEncoding = "AUTO")
AutoH2oDRFRegression()
AutoH2oDRFRegression() utilizes the H2o Distributed Random Forest algorithm in the below steps
Code Example
# Create some dummy correlated data
data <- RemixAutoML::FakeDataGenerator(
  Correlation = 0.85,
  N = 1000,
  ID = 2,
  ZIP = 0,
  AddDate = FALSE,
  Classification = FALSE,
  MultiClass = FALSE)

# Run function
TestModel <- RemixAutoML::AutoH2oDRFRegression(

  # Compute management
  MaxMem = {gc();paste0(as.character(floor(as.numeric(system("awk '/MemFree/ {print $2}' /proc/meminfo", intern=TRUE)) / 1000000)),"G")},
  NThreads = max(1L, parallel::detectCores() - 2L),
  H2OShutdown = TRUE,
  H2OStartUp = TRUE,
  IfSaveModel = "mojo",

  # Model evaluation:
  eval_metric = "RMSE",
  NumOfParDepPlots = 3,

  # Metadata arguments:
  model_path = normalizePath("./"),
  metadata_path = NULL,
  ModelID = "FirstModel",
  ReturnModelObjects = TRUE,
  SaveModelObjects = FALSE,
  SaveInfoToPDF = FALSE,

  # Data Args
  data = data,
  TrainOnFull = FALSE,
  ValidationData = NULL,
  TestData = NULL,
  TargetColumnName = "Adrian",
  FeatureColNames = names(data)[!names(data) %in% c("IDcol_1", "IDcol_2","Adrian")],
  WeightsColumn = NULL,
  TransformNumericColumns = NULL,
  Methods = c("BoxCox", "Asinh", "Asin", "Log", "LogPlus1", "Sqrt", "Logit", "YeoJohnson"),

  # Grid Tuning Args
  GridStrategy = "Cartesian",
  GridTune = FALSE,
  MaxModelsInGrid = 10,
  MaxRuntimeSecs = 60*60*24,
  StoppingRounds = 10,

  # ML Args
  Trees = 50,
  MaxDepth = 20,
  SampleRate = 0.632,
  MTries = -1,
  ColSampleRatePerTree = 1,
  ColSampleRatePerTreeLevel = 1,
  MinRows = 1,
  NBins = 20,
  NBinsCats = 1024,
  NBinsTopLevel = 1024,
  HistogramType = "AUTO",
  CategoricalEncoding = "AUTO")
AutoH2oGLMRegression()
AutoH2oGLMRegression() utilizes the H2o generalized linear model algorithm in the below steps
Code Example
# Create some dummy correlated data
data <- RemixAutoML::FakeDataGenerator(
  Correlation = 0.85,
  N = 1000,
  ID = 2,
  ZIP = 0,
  AddDate = FALSE,
  Classification = FALSE,
  MultiClass = FALSE)

# Run function
TestModel <- RemixAutoML::AutoH2oGLMRegression(

  # Compute management
  MaxMem = {gc();paste0(as.character(floor(as.numeric(system("awk '/MemFree/ {print $2}' /proc/meminfo", intern=TRUE)) / 1000000)),"G")},
  NThreads = max(1, parallel::detectCores()-2),
  H2OShutdown = TRUE,
  H2OStartUp = TRUE,
  IfSaveModel = "mojo",

  # Model evaluation:
  eval_metric = "RMSE",
  NumOfParDepPlots = 3,

  # Metadata arguments:
  model_path = NULL,
  metadata_path = NULL,
  ModelID = "FirstModel",
  ReturnModelObjects = TRUE,
  SaveModelObjects = FALSE,
  SaveInfoToPDF = FALSE,

  # Data arguments:
  data = data,
  TrainOnFull = FALSE,
  ValidationData = NULL,
  TestData = NULL,
  TargetColumnName = "Adrian",
  FeatureColNames = names(data)[!names(data) %in% c("IDcol_1", "IDcol_2","Adrian")],
  RandomColNumbers = NULL,
  InteractionColNumbers = NULL,
  WeightsColumn = NULL,
  TransformNumericColumns = NULL,
  Methods = c("BoxCox", "Asinh", "Asin", "Log", "LogPlus1", "Sqrt", "Logit", "YeoJohnson"),

  # Model args
  GridTune = FALSE,
  GridStrategy = "Cartesian",
  StoppingRounds = 10,
  MaxRunTimeSecs = 3600 * 24 * 7,
  MaxModelsInGrid = 10,
  Distribution = "gaussian",
  Link = "identity",
  TweedieLinkPower = NULL,
  TweedieVariancePower = NULL,
  RandomDistribution = NULL,
  RandomLink = NULL,
  Solver = "AUTO",
  Alpha = NULL,
  Lambda = NULL,
  LambdaSearch = FALSE,
  NLambdas = -1,
  Standardize = TRUE,
  RemoveCollinearColumns = FALSE,
  InterceptInclude = TRUE,
  NonNegativeCoefficients = FALSE)
AutoH2oMLRegression()
AutoH2oMLRegression() utilizes the H2o AutoML algorithm in the below steps
Code Example
# Create some dummy correlated data with numeric and categorical features
data <- RemixAutoML::FakeDataGenerator(
  Correlation = 0.85,
  N = 1000,
  ID = 2,
  ZIP = 0,
  AddDate = FALSE,
  Classification = FALSE,
  MultiClass = FALSE)

# Run function
TestModel <- RemixAutoML::AutoH2oMLRegression(

  # Compute management
  MaxMem = "32G",
  NThreads = max(1, parallel::detectCores()-2),
  H2OShutdown = TRUE,
  IfSaveModel = "mojo",

  # Model evaluation
  eval_metric = "RMSE",
  NumOfParDepPlots = 3,

  # Metadata arguments
  model_path = NULL,
  metadata_path = NULL,
  ModelID = "FirstModel",
  ReturnModelObjects = TRUE,
  SaveModelObjects = FALSE,

  # Data arguments
  TrainOnFull = FALSE,
  ValidationData = NULL,
  TestData = NULL,
  TargetColumnName = "Adrian",
  FeatureColNames = names(data)[!names(data) %in% c("IDcol_1", "IDcol_2","Adrian")],
  TransformNumericColumns = NULL,
  Methods = c("BoxCox", "Asinh", "Asin", "Log", "LogPlus1", "Logit", "YeoJohnson"),

  # Model args
  GridTune = FALSE,
  ExcludeAlgos = NULL,
  Trees = 50,
  MaxModelsInGrid = 10)
AutoH2oGAMRegression()
AutoH2oGLMRegression() utilizes the H2o generalized linear model algorithm in the below steps
Code Example
# Create some dummy correlated data
data <- RemixAutoML::FakeDataGenerator(
  Correlation = 0.85,
  N = 1000,
  ID = 2,
  ZIP = 0,
  AddDate = FALSE,
  Classification = FALSE,
  MultiClass = FALSE)

# Define GAM Columns to use - up to 9 are allowed
GamCols <- names(which(unlist(lapply(data, is.numeric))))
GamCols <- GamCols[!GamCols %in% c("Adrian","IDcol_1","IDcol_2")]
GamCols <- GamCols[1L:(min(9L,length(GamCols)))]

# Run function
TestModel <- RemixAutoML::AutoH2oGAMRegression(

  # Compute management
  MaxMem = {gc();paste0(as.character(floor(as.numeric(system("awk '/MemFree/ {print $2}' /proc/meminfo", intern=TRUE)) / 1000000)),"G")},
  NThreads = max(1, parallel::detectCores()-2),
  H2OShutdown = TRUE,
  H2OStartUp = TRUE,
  IfSaveModel = "mojo",

  # Model evaluation:
  eval_metric = "RMSE",
  NumOfParDepPlots = 3,

  # Metadata arguments:
  model_path = NULL,
  metadata_path = NULL,
  ModelID = "FirstModel",
  ReturnModelObjects = TRUE,
  SaveModelObjects = FALSE,
  SaveInfoToPDF = FALSE,

  # Data arguments:
  data = data,
  TrainOnFull = FALSE,
  ValidationData = NULL,
  TestData = NULL,
  TargetColumnName = "Adrian",
  FeatureColNames = names(data)[!names(data) %in% c("IDcol_1", "IDcol_2","Adrian")],
  InteractionColNumbers = NULL,
  WeightsColumn = NULL,
  GamColNames = GamCols,
  TransformNumericColumns = NULL,
  Methods = c("BoxCox", "Asinh", "Asin", "Log", "LogPlus1", "Sqrt", "Logit", "YeoJohnson"),

  # Model args
  num_knots = NULL,
  keep_gam_cols = TRUE,
  GridTune = FALSE,
  GridStrategy = "Cartesian",
  StoppingRounds = 10,
  MaxRunTimeSecs = 3600 * 24 * 7,
  MaxModelsInGrid = 10,
  Distribution = "gaussian",
  Link = "Family_Default",
  TweedieLinkPower = NULL,
  TweedieVariancePower = NULL,
  Solver = "AUTO",
  Alpha = NULL,
  Lambda = NULL,
  LambdaSearch = FALSE,
  NLambdas = -1,
  Standardize = TRUE,
  RemoveCollinearColumns = FALSE,
  InterceptInclude = TRUE,
  NonNegativeCoefficients = FALSE)
The Auto_Regression() models handle a multitude of tasks. In order:
- Convert your data to data.table format for faster processing
- Transform your target variable using the best normalization method based on the
AutoTransformationCreate()function - Create train, validation, and test data, utilizing the
AutoDataPartition()function, if you didn't supply those directly to the function - Consoldate columns that are used for modeling and what metadata you want returned in your test data with predictions
- Dichotomize categorical variables (for
AutoXGBoostRegression()) and save the factor levels for scoring in a way that guarentees consistency across training, validation, and test data sets, utilizing theDummifyDT()function - Save the final modeling column names for reference
- Handles the data conversion to the appropriate modeling type, such as CatBoost, H2O, and XGBoost
- Multi-armed bandit hyperparameter tuning using randomized probability matching, if you choose to grid tune
- Loop through the grid-tuning process, building N models
- Collect the evaluation metrics for each grid tune run
- Identify the best model of the set of models built in the grid tuning search
- Save the hyperparameters from the winning grid tuned model
- Build the final model based on the best model from the grid tuning model search (I remove each model after evaluation metrics are generated in the grid tune to avoid memory overflow)
- Back-transform your predictions based on the best transformation used earlier in the process
- Collect evaluation metrics based on performance on test data (based on back-transformed data)
- Store the final predictions with the associated test data and other columns you want included in that set
- Save your transformation metadata for recreating them in a scoring process
- Build out and save an Evaluation Calibration Line Plot and Evaluation Calibration Box-Plot, using the
EvalPlot()function - Generate and save Variable Importance
- Generate and save Partital Dependence Calibration Line Plots and Partital Dependence Calibration Box-Plots, using the
ParDepPlots()function - Return all the objects generated in a named list for immediate use and evaluation
Binary Classification
click to expand
AutoCatBoostClassifier() GPU Capable
AutoCatBoostClassifier() utilizes the CatBoost algorithm in the below steps
Code Example
# Create some dummy correlated data
data <- RemixAutoML::FakeDataGenerator(
  Correlation = 0.85,
  N = 10000,
  ID = 2,
  ZIP = 0,
  AddDate = FALSE,
  Classification = TRUE,
  MultiClass = FALSE)

# Run function
TestModel <- RemixAutoML::AutoCatBoostClassifier(

  # GPU or CPU and the number of available GPUs
  task_type = "GPU",
  NumGPUs = 1,

  # Metadata args
  ModelID = "Test_Model_1",
  model_path = normalizePath("./"),
  metadata_path = normalizePath("./"),
  SaveModelObjects = FALSE,
  ReturnModelObjects = TRUE,
  SaveInfoToPDF = FALSE,

  # Data args
  data = data,
  TrainOnFull = FALSE,
  ValidationData = NULL,
  TestData = NULL,
  TargetColumnName = "Adrian",
  FeatureColNames = names(data)[!names(data) %in% c("IDcol_1","IDcol_2","Adrian")],
  PrimaryDateColumn = NULL,
  ClassWeights = c(1L,1L),
  IDcols = c("IDcol_1","IDcol_2"),

  # Evaluation args
  eval_metric = "AUC",
  loss_function = "Logloss",
  MetricPeriods = 10L,
  NumOfParDepPlots = ncol(data)-1L-2L,

  # Grid tuning args
  PassInGrid = NULL,
  GridTune = TRUE,
  MaxModelsInGrid = 30L,
  MaxRunsWithoutNewWinner = 20L,
  MaxRunMinutes = 24L*60L,
  Shuffles = 4L,
  BaselineComparison = "default",

  # ML args
  Trees = seq(100L, 500L, 50L),
  Depth = seq(4L, 8L, 1L),
  LearningRate = seq(0.01,0.10,0.01),
  L2_Leaf_Reg = seq(1.0, 10.0, 1.0),
  RandomStrength = 1,
  BorderCount = 128,
  RSM = c(0.80, 0.85, 0.90, 0.95, 1.0),
  BootStrapType = c("Bayesian", "Bernoulli", "Poisson", "MVS", "No"),
  GrowPolicy = c("SymmetricTree", "Depthwise", "Lossguide"),
  langevin = FALSE,
  diffusion_temperature = 10000,
  model_size_reg = 0.5,
  feature_border_type = "GreedyLogSum",
  sampling_unit = "Group",
  subsample = NULL,
  score_function = "Cosine",
  min_data_in_leaf = 1)
AutoXGBoostClassifier() GPU Capable
AutoXGBoostClassifier() utilizes the XGBoost algorithm in the below steps
Code Example
# Create some dummy correlated data
data <- RemixAutoML::FakeDataGenerator(
  Correlation = 0.85,
  N = 1000L,
  ID = 2L,
  ZIP = 0L,
  AddDate = FALSE,
  Classification = TRUE,
  MultiClass = FALSE)

# Run function
TestModel <- RemixAutoML::AutoXGBoostClassifier(

  # GPU or CPU
  TreeMethod = "hist",
  NThreads = parallel::detectCores(),

  # Metadata args
  model_path = normalizePath("./"),
  metadata_path = NULL,
  ModelID = "Test_Model_1",
  ReturnFactorLevels = TRUE,
  ReturnModelObjects = TRUE,
  SaveModelObjects = FALSE,

  # Data args
  data = data,
  TrainOnFull = FALSE,
  ValidationData = NULL,
  TestData = NULL,
  TargetColumnName = "Adrian",
  FeatureColNames = names(data)[!names(data) %in%
                                  c("IDcol_1", "IDcol_2","Adrian")],
  IDcols = c("IDcol_1","IDcol_2"),

  # Model evaluation
  LossFunction = 'reg:logistic',
  eval_metric = "auc",
  NumOfParDepPlots = 3L,

  # Grid tuning args
  PassInGrid = NULL,
  GridTune = FALSE,
  BaselineComparison = "default",
  MaxModelsInGrid = 10L,
  MaxRunsWithoutNewWinner = 20L,
  MaxRunMinutes = 24L*60L,
  Verbose = 1L,

  # ML args
  Shuffles = 1L,
  Trees = 50L,
  eta = 0.05,
  max_depth = 4L,
  min_child_weight = 1.0,
  subsample = 0.55,
  colsample_bytree = 0.55)
AutoH2oGBMClassifier()
AutoH2oGBMClassifier() utilizes the H2O Gradient Boosting algorithm in the below steps
Code Example
# Create some dummy correlated data
data <- RemixAutoML::FakeDataGenerator(
  Correlation = 0.85,
  N = 1000L,
  ID = 2L,
  ZIP = 0L,
  AddDate = FALSE,
  Classification = TRUE,
  MultiClass = FALSE)

TestModel <- RemixAutoML::AutoH2oGBMClassifier(

  # Compute management
  MaxMem = {gc();paste0(as.character(floor(as.numeric(system("awk '/MemFree/ {print $2}' /proc/meminfo", intern=TRUE)) / 1000000)),"G")},
  NThreads = max(1, parallel::detectCores()-2),
  H2OShutdown = TRUE,
  H2OStartUp = TRUE,
  IfSaveModel = "mojo",

  # Model evaluation
  NumOfParDepPlots = 3,

  # Metadata arguments:
  model_path = normalizePath("./"),
  metadata_path = file.path(normalizePath("./")),
  ModelID = "FirstModel",
  ReturnModelObjects = TRUE,
  SaveModelObjects = FALSE,
  SaveInfoToPDF = FALSE,

  # Data arguments
  data = data,
  TrainOnFull = FALSE,
  ValidationData = NULL,
  TestData = NULL,
  TargetColumnName = "Adrian",
  FeatureColNames = names(data)[!names(data) %in% c("IDcol_1", "IDcol_2","Adrian")],
  WeightsColumn = NULL,

  # ML grid tuning args
  GridTune = FALSE,
  GridStrategy = "Cartesian",
  MaxRuntimeSecs = 60*60*24,
  StoppingRounds = 10,
  MaxModelsInGrid = 2,

  # Model args
  Trees = 50,
  LearnRate = 0.10,
  LearnRateAnnealing = 1,
  eval_metric = "auc",
  Distribution = "bernoulli",
  MaxDepth = 20,
  SampleRate = 0.632,
  ColSampleRate = 1,
  ColSampleRatePerTree = 1,
  ColSampleRatePerTreeLevel  = 1,
  MinRows = 1,
  NBins = 20,
  NBinsCats = 1024,
  NBinsTopLevel = 1024,
  HistogramType = "AUTO",
  CategoricalEncoding = "AUTO")
AutoH2oDRFClassifier()
AutoH2oDRFClassifier() utilizes the H2O Distributed Random Forest algorithm in the below steps
Code Example
# Create some dummy correlated data
data <- RemixAutoML::FakeDataGenerator(
  Correlation = 0.85,
  N = 1000L,
  ID = 2L,
  ZIP = 0L,
  AddDate = FALSE,
  Classification = TRUE,
  MultiClass = FALSE)

TestModel <- RemixAutoML::AutoH2oDRFClassifier(

  # Compute management
  MaxMem = {gc();paste0(as.character(floor(as.numeric(system("awk '/MemFree/ {print $2}' /proc/meminfo", intern=TRUE)) / 1000000)),"G")},
  NThreads = max(1L, parallel::detectCores() - 2L),
  IfSaveModel = "mojo",
  H2OShutdown = FALSE,
  H2OStartUp = TRUE,

  # Metadata arguments:
  eval_metric = "auc",
  NumOfParDepPlots = 3L,

  # Data arguments:
  model_path = normalizePath("./"),
  metadata_path = NULL,
  ModelID = "FirstModel",
  ReturnModelObjects = TRUE,
  SaveModelObjects = FALSE,
  SaveInfoToPDF = FALSE,

  # Model evaluation:
  data,
  TrainOnFull = FALSE,
  ValidationData = NULL,
  TestData = NULL,
  TargetColumnName = "Adrian",
  FeatureColNames = names(data)[!names(data) %in% c("IDcol_1", "IDcol_2", "Adrian")],
  WeightsColumn = NULL,

  # Grid Tuning Args
  GridStrategy = "Cartesian",
  GridTune = FALSE,
  MaxModelsInGrid = 10,
  MaxRuntimeSecs = 60*60*24,
  StoppingRounds = 10,

  # Model args
  Trees = 50L,
  MaxDepth = 20,
  SampleRate = 0.632,
  MTries = -1,
  ColSampleRatePerTree = 1,
  ColSampleRatePerTreeLevel = 1,
  MinRows = 1,
  NBins = 20,
  NBinsCats = 1024,
  NBinsTopLevel = 1024,
  HistogramType = "AUTO",
  CategoricalEncoding = "AUTO")
AutoH2oGLMClassifier()
AutoH2oGLMClassifier() utilizes the H2O generalized linear model algorithm in the below steps
Code Example
# Create some dummy correlated data with numeric and categorical features
data <- RemixAutoML::FakeDataGenerator(
  Correlation = 0.85,
  N = 1000L,
  ID = 2L,
  ZIP = 0L,
  AddDate = FALSE,
  Classification = TRUE,
  MultiClass = FALSE)

# Run function
TestModel <- RemixAutoML::AutoH2oGLMClassifier(

  # Compute management
  MaxMem = {gc();paste0(as.character(floor(as.numeric(system("awk '/MemFree/ {print $2}' /proc/meminfo", intern=TRUE)) / 1000000)),"G")},
  NThreads = max(1, parallel::detectCores()-2),
  H2OShutdown = TRUE,
  H2OStartUp = TRUE,
  IfSaveModel = "mojo",

  # Model evaluation args
  eval_metric = "auc",
  NumOfParDepPlots = 3,

  # Metadata args
  model_path = NULL,
  metadata_path = NULL,
  ModelID = "FirstModel",
  ReturnModelObjects = TRUE,
  SaveModelObjects = FALSE,
  SaveInfoToPDF = FALSE,

  # Data args
  data = data,
  TrainOnFull = FALSE,
  ValidationData = NULL,
  TestData = NULL,
  TargetColumnName = "Adrian",
  FeatureColNames = names(data)[!names(data) %in%
                                  c("IDcol_1", "IDcol_2","Adrian")],
  RandomColNumbers = NULL,
  InteractionColNumbers = NULL,
  WeightsColumn = NULL,
  TransformNumericColumns = NULL,
  Methods = c("BoxCox", "Asinh", "Asin", "Log", "LogPlus1", "Sqrt", "Logit", "YeoJohnson"),

  # ML args
  GridTune = FALSE,
  GridStrategy = "Cartesian",
  StoppingRounds = 10,
  MaxRunTimeSecs = 3600 * 24 * 7,
  MaxModelsInGrid = 10,
  Distribution = "binomial",
  Link = "logit",
  RandomDistribution = NULL,
  RandomLink = NULL,
  Solver = "AUTO",
  Alpha = NULL,
  Lambda = NULL,
  LambdaSearch = FALSE,
  NLambdas = -1,
  Standardize = TRUE,
  RemoveCollinearColumns = FALSE,
  InterceptInclude = TRUE,
  NonNegativeCoefficients = FALSE)
AutoH2oMLClassifier()
AutoH2oMLClassifier() utilizes the H2o AutoML algorithm in the below steps
Code Example
# Create some dummy correlated data with numeric and categorical features
data <- RemixAutoML::FakeDataGenerator(
  Correlation = 0.85,
  N = 1000L,
  ID = 2L,
  ZIP = 0L,
  AddDate = FALSE,
  Classification = TRUE,
  MultiClass = FALSE)

TestModel <- RemixAutoML::AutoH2oMLClassifier(
   data,
   TrainOnFull = FALSE,
   ValidationData = NULL,
   TestData = NULL,
   TargetColumnName = "Adrian",
   FeatureColNames = names(data)[!names(data) %in% c("IDcol_1", "IDcol_2","Adrian")],
   ExcludeAlgos = NULL,
   eval_metric = "auc",
   Trees = 50,
   MaxMem = "32G",
   NThreads = max(1, parallel::detectCores()-2),
   MaxModelsInGrid = 10,
   model_path = normalizePath("./"),
   metadata_path = file.path(normalizePath("./"), "MetaData"),
   ModelID = "FirstModel",
   NumOfParDepPlots = 3,
   ReturnModelObjects = TRUE,
   SaveModelObjects = FALSE,
   IfSaveModel = "mojo",
   H2OShutdown = FALSE,
   HurdleModel = FALSE)
AutoH2oGAMClassifier()
Code Example
# Create some dummy correlated data
data <- RemixAutoML::FakeDataGenerator(
  Correlation = 0.85,
  N = 1000,
  ID = 2,
  ZIP = 0,
  AddDate = FALSE,
  Classification = TRUE,
  MultiClass = FALSE)

# Define GAM Columns to use - up to 9 are allowed
GamCols <- names(which(unlist(lapply(data, is.numeric))))
GamCols <- GamCols[!GamCols %in% c("Adrian","IDcol_1","IDcol_2")]
GamCols <- GamCols[1L:(min(9L,length(GamCols)))]

# Run function
TestModel <- RemixAutoML::AutoH2oGAMClassifier(

  # Compute management
  MaxMem = {gc();paste0(as.character(floor(as.numeric(system("awk '/MemFree/ {print $2}' /proc/meminfo", intern=TRUE)) / 1000000)),"G")},
  NThreads = max(1, parallel::detectCores()-2),
  H2OShutdown = TRUE,
  H2OStartUp = TRUE,
  IfSaveModel = "mojo",

  # Model evaluation:
  eval_metric = "auc",
  NumOfParDepPlots = 3,

  # Metadata arguments:
  model_path = NULL,
  metadata_path = NULL,
  ModelID = "FirstModel",
  ReturnModelObjects = TRUE,
  SaveModelObjects = FALSE,
  SaveInfoToPDF = FALSE,

  # Data arguments:
  data = data,
  TrainOnFull = FALSE,
  ValidationData = NULL,
  TestData = NULL,
  TargetColumnName = "Adrian",
  FeatureColNames = names(data)[!names(data) %in% c("IDcol_1", "IDcol_2","Adrian")],
  WeightsColumn = NULL,
  GamColNames = GamCols,

  # ML args
  num_knots = NULL,
  keep_gam_cols = TRUE,
  GridTune = FALSE,
  GridStrategy = "Cartesian",
  StoppingRounds = 10,
  MaxRunTimeSecs = 3600 * 24 * 7,
  MaxModelsInGrid = 10,
  Distribution = "binomial",
  Link = "logit",
  Solver = "AUTO",
  Alpha = NULL,
  Lambda = NULL,
  LambdaSearch = FALSE,
  NLambdas = -1,
  Standardize = TRUE,
  RemoveCollinearColumns = FALSE,
  InterceptInclude = TRUE,
  NonNegativeCoefficients = FALSE)
The Auto_Classifier() models handle a multitude of tasks. In order:
- Convert your data to data.table format for faster processing
- Create train, validation, and test data if you didn't supply those directly to the function
- Consoldate columns that are used for modeling and what is to be kept for data returned
- Dichotomize categorical variables (for AutoXGBoostRegression) and save the factor levels for scoring in a way that guarentees consistency across training, validation, and test data sets
- Saves the final column names for modeling to a csv for later reference
- Handles the data conversion to the appropriate type, based on model type (CatBoost, H2O, and XGBoost)
- Multi-armed bandit hyperparameter tuning using randomized probability matching, if you choose to grid tune
- Build the grid tuned models
- Collect the evaluation metrics for each grid tune run
- Identify the best model of the set of models built in the grid tuning setup
- Save the hyperparameters from the winning grid tuned model
- Build the final model based on the best model from the grid tuning model search
- Collect evaluation metrics based on performance on test data
- Store the final predictions with the associated test data and other columns you want included in that set
- Build out and save an Evaluation Calibration Line Plot
- Build out and save an ROC plot with the top 5 models used in grid-tuning (includes the winning model)
- Generate and save Variable Importance data
- Generate and save Partital Dependence Calibration Line Plots
- Return all the objects generated in a named list for immediate use
Multinomial Classification
click to expand
AutoCatBoostMultiClass() GPU Capable
AutoCatBoostMultiClass() utilizes the CatBoost algorithm in the below steps
Code Example
# Create some dummy correlated data
data <- RemixAutoML::FakeDataGenerator(
  Correlation = 0.85,
  N = 10000L,
  ID = 2L,
  ZIP = 0L,
  AddDate = FALSE,
  Classification = FALSE,
  MultiClass = TRUE)

# Run function
TestModel <- RemixAutoML::AutoCatBoostMultiClass(

  # GPU or CPU and the number of available GPUs
  task_type = "GPU",
  NumGPUs = 1,

  # Metadata args
  ModelID = "Test_Model_1",
  model_path = normalizePath("./"),
  metadata_path = normalizePath("./"),
  SaveModelObjects = FALSE,
  ReturnModelObjects = TRUE,

  # Data args
  data = data,
  TrainOnFull = FALSE,
  ValidationData = NULL,
  TestData = NULL,
  TargetColumnName = "Adrian",
  FeatureColNames = names(data)[!names(data) %in% c("IDcol_1", "IDcol_2","Adrian")],
  PrimaryDateColumn = NULL,
  ClassWeights = c(1L,1L,1L,1L,1L),
  IDcols = c("IDcol_1","IDcol_2"),

  # Model evaluation
  eval_metric = "MCC",
  loss_function = "MultiClassOneVsAll",
  grid_eval_metric = "Accuracy",
  MetricPeriods = 10L,

  # Grid tuning args
  PassInGrid = NULL,
  GridTune = TRUE,
  MaxModelsInGrid = 30L,
  MaxRunsWithoutNewWinner = 20L,
  MaxRunMinutes = 24L*60L,
  Shuffles = 4L,
  BaselineComparison = "default",

  # ML args
  langevin = FALSE,
  diffusion_temperature = 10000,
  Trees = seq(100L, 500L, 50L),
  Depth = seq(4L, 8L, 1L),
  LearningRate = seq(0.01,0.10,0.01),
  L2_Leaf_Reg = seq(1.0, 10.0, 1.0),
  RandomStrength = 1,
  BorderCount = 254,
  RSM = c(0.80, 0.85, 0.90, 0.95, 1.0),
  BootStrapType = c("Bayesian", "Bernoulli", "Poisson", "MVS", "No"),
  GrowPolicy = c("SymmetricTree", "Depthwise", "Lossguide"),
  model_size_reg = 0.5,
  feature_border_type = "GreedyLogSum",
  sampling_unit = "Group",
  subsample = NULL,
  score_function = "Cosine",
  min_data_in_leaf = 1)
AutoXGBoostMultiClass() GPU Capable
AutoXGBoostMultiClass() utilizes the XGBoost algorithm in the below steps
Code Example
# Create some dummy correlated data
data <- RemixAutoML::FakeDataGenerator(
  Correlation = 0.85,
  N = 1000L,
  ID = 2L,
  ZIP = 0L,
  AddDate = FALSE,
  Classification = FALSE,
  MultiClass = TRUE)

# Run function
TestModel <- RemixAutoML::AutoXGBoostMultiClass(

  # GPU or CPU
  TreeMethod = "hist",
  NThreads = parallel::detectCores(),

  # Metadata args
  model_path = normalizePath("./"),
  metadata_path = normalizePath("./"),
  ModelID = "Test_Model_1",
  ReturnFactorLevels = TRUE,
  ReturnModelObjects = TRUE,
  SaveModelObjects = FALSE,

  # Data args
  data = data,
  TrainOnFull = FALSE,
  ValidationData = NULL,
  TestData = NULL,
  TargetColumnName = "Adrian",
  FeatureColNames = names(data)[!names(data) %in% c("IDcol_1", "IDcol_2","Adrian")],
  IDcols = c("IDcol_1","IDcol_2"),

  # Model evaluation args
  eval_metric = "merror",
  LossFunction = 'multi:softmax',
  grid_eval_metric = "accuracy",
  NumOfParDepPlots = 3L,

  # Grid tuning args
  PassInGrid = NULL,
  GridTune = FALSE,
  BaselineComparison = "default",
  MaxModelsInGrid = 10L,
  MaxRunsWithoutNewWinner = 20L,
  MaxRunMinutes = 24L*60L,
  Verbose = 1L,

  # ML args
  Shuffles = 1L,
  Trees = 50L,
  eta = 0.05,
  max_depth = 4L,
  min_child_weight = 1.0,
  subsample = 0.55,
  colsample_bytree = 0.55)
AutoH2oGBMMultiClass()
AutoH2oGBMMultiClass() utilizes the H2O Gradient Boosting algorithm in the below steps
Code Example
# Create some dummy correlated data
data <- RemixAutoML::FakeDataGenerator(
  Correlation = 0.85,
  N = 1000,
  ID = 2,
  ZIP = 0,
  AddDate = FALSE,
  Classification = FALSE,
  MultiClass = TRUE)

# Run function
TestModel <- RemixAutoML::AutoH2oGBMMultiClass(
   data,
   TrainOnFull = FALSE,
   ValidationData = NULL,
   TestData = NULL,
   TargetColumnName = "Adrian",
   FeatureColNames = names(data)[!names(data) %in% c("IDcol_1", "IDcol_2","Adrian")],
   WeightsColumn = NULL,
   eval_metric = "logloss",
   MaxMem = {gc();paste0(as.character(floor(as.numeric(system("awk '/MemFree/ {print $2}' /proc/meminfo", intern=TRUE)) / 1000000)),"G")},
   NThreads = max(1, parallel::detectCores()-2),
   model_path = normalizePath("./"),
   metadata_path = file.path(normalizePath("./")),
   ModelID = "FirstModel",
   ReturnModelObjects = TRUE,
   SaveModelObjects = FALSE,
   IfSaveModel = "mojo",
   H2OShutdown = TRUE,
   H2OStartUp = TRUE,

   # Model args
   GridTune = FALSE,
   GridStrategy = "Cartesian",
   MaxRuntimeSecs = 60*60*24,
   StoppingRounds = 10,
   MaxModelsInGrid = 2,
   Trees = 50,
   LearnRate = 0.10,
   LearnRateAnnealing = 1,
   eval_metric = "RMSE",
   Distribution = "multinomial",
   MaxDepth = 20,
   SampleRate = 0.632,
   ColSampleRate = 1,
   ColSampleRatePerTree = 1,
   ColSampleRatePerTreeLevel  = 1,
   MinRows = 1,
   NBins = 20,
   NBinsCats = 1024,
   NBinsTopLevel = 1024,
   HistogramType = "AUTO",
   CategoricalEncoding = "AUTO")
AutoH2oDRFMultiClass()
AutoH2oDRFMultiClass() utilizes the H2O Distributed Random Forest algorithm in the below steps
Code Example
# Create some dummy correlated data
data <- RemixAutoML::FakeDataGenerator(
  Correlation = 0.85,
  N = 1000L,
  ID = 2L,
  ZIP = 0L,
  AddDate = FALSE,
  Classification = FALSE,
  MultiClass = TRUE)

# Run function
TestModel <- RemixAutoML::AutoH2oDRFMultiClass(
   data,
   TrainOnFull = FALSE,
   ValidationData = NULL,
   TestData = NULL,
   TargetColumnName = "Adrian",
   FeatureColNames = names(data)[!names(data) %in% c("IDcol_1", "IDcol_2","Adrian")],
   WeightsColumn = NULL,
   eval_metric = "logloss",
   MaxMem = {gc();paste0(as.character(floor(as.numeric(system("awk '/MemFree/ {print $2}' /proc/meminfo", intern=TRUE)) / 1000000)),"G")},
   NThreads = max(1, parallel::detectCores()-2),
   model_path = normalizePath("./"),
   metadata_path = file.path(normalizePath("./")),
   ModelID = "FirstModel",
   ReturnModelObjects = TRUE,
   SaveModelObjects = FALSE,
   IfSaveModel = "mojo",
   H2OShutdown = FALSE,
   H2OStartUp = TRUE,

   # Grid Tuning Args
   GridStrategy = "Cartesian",
   GridTune = FALSE,
   MaxModelsInGrid = 10,
   MaxRuntimeSecs = 60*60*24,
   StoppingRounds = 10,

   # ML args
   Trees = 50,
   MaxDepth = 20,
   SampleRate = 0.632,
   MTries = -1,
   ColSampleRatePerTree = 1,
   ColSampleRatePerTreeLevel = 1,
   MinRows = 1,
   NBins = 20,
   NBinsCats = 1024,
   NBinsTopLevel = 1024,
   HistogramType = "AUTO",
   CategoricalEncoding = "AUTO")
AutoH2oGLMMultiClass()
AutoH2oGLMMultiClass() utilizes the H2O generalized linear model algorithm in the below steps
Code Example
# Create some dummy correlated data with numeric and categorical features
data <- RemixAutoML::FakeDataGenerator(
  Correlation = 0.85,
  N = 1000L,
  ID = 2L,
  ZIP = 0L,
  AddDate = FALSE,
  Classification = FALSE,
  MultiClass = TRUE)

# Run function
TestModel <- RemixAutoML::AutoH2oGLMMultiClass(

  # Compute management
  MaxMem = {gc();paste0(as.character(floor(as.numeric(system("awk '/MemFree/ {print $2}' /proc/meminfo", intern=TRUE)) / 1000000)),"G")},
  NThreads = max(1, parallel::detectCores()-2),
  H2OShutdown = TRUE,
  H2OStartUp = TRUE,
  IfSaveModel = "mojo",

  # Model evaluation:
  eval_metric = "logloss",
  NumOfParDepPlots = 3,

  # Metadata arguments:
  model_path = NULL,
  metadata_path = NULL,
  ModelID = "FirstModel",
  ReturnModelObjects = TRUE,
  SaveModelObjects = FALSE,
  SaveInfoToPDF = FALSE,

  # Data arguments:
  data = data,
  TrainOnFull = FALSE,
  ValidationData = NULL,
  TestData = NULL,
  TargetColumnName = "Adrian",
  FeatureColNames = names(data)[!names(data) %in% c("IDcol_1", "IDcol_2","Adrian")],
  RandomColNumbers = NULL,
  InteractionColNumbers = NULL,
  WeightsColumn = NULL,
  TransformNumericColumns = NULL,
  Methods = c("BoxCox", "Asinh", "Asin", "Log", "LogPlus1", "Sqrt", "Logit", "YeoJohnson"),

  # Model args
  GridTune = FALSE,
  GridStrategy = "Cartesian",
  StoppingRounds = 10,
  MaxRunTimeSecs = 3600 * 24 * 7,
  MaxModelsInGrid = 10,
  Distribution = "multinomial",
  Link = "family_default",
  RandomDistribution = NULL,
  RandomLink = NULL,
  Solver = "AUTO",
  Alpha = NULL,
  Lambda = NULL,
  LambdaSearch = FALSE,
  NLambdas = -1,
  Standardize = TRUE,
  RemoveCollinearColumns = FALSE,
  InterceptInclude = TRUE,
  NonNegativeCoefficients = FALSE)
AutoH2oMLMultiClass()
AutoH2oMLMultiClass() utilizes the H2o AutoML algorithm in the below steps
Code Example
# Create some dummy correlated data with numeric and categorical features
data <- RemixAutoML::FakeDataGenerator(Correlation = 0.85, N = 1000, ID = 2, ZIP = 0, AddDate = FALSE, Classification = FALSE, MultiClass = TRUE)

# Run function
TestModel <- RemixAutoML::AutoH2oMLMultiClass(
   data,
   TrainOnFull = FALSE,
   ValidationData = NULL,
   TestData = NULL,
   TargetColumnName = "Adrian",
   FeatureColNames = names(data)[!names(data) %in% c("IDcol_1", "IDcol_2","Adrian")],
   ExcludeAlgos = NULL,
   eval_metric = "logloss",
   Trees = 50,
   MaxMem = "32G",
   NThreads = max(1, parallel::detectCores()-2),
   MaxModelsInGrid = 10,
   model_path = normalizePath("./"),
   metadata_path = file.path(normalizePath("./"), "MetaData"),
   ModelID = "FirstModel",
   ReturnModelObjects = TRUE,
   SaveModelObjects = FALSE,
   IfSaveModel = "mojo",
   H2OShutdown = FALSE,
   HurdleModel = FALSE)
AutoH2oGAMMultiClass()
Code Example
# Create some dummy correlated data with numeric and categorical features
data <- RemixAutoML::FakeDataGenerator(
  Correlation = 0.85,
  N = 1000L,
  ID = 2L,
  ZIP = 0L,
  AddDate = FALSE,
  Classification = FALSE,
  MultiClass = TRUE)

# Define GAM Columns to use - up to 9 are allowed
GamCols <- names(which(unlist(lapply(data, is.numeric))))
GamCols <- GamCols[!GamCols %in% c("Adrian","IDcol_1","IDcol_2")]
GamCols <- GamCols[1L:(min(9L,length(GamCols)))]

# Run function
TestModel <- RemixAutoML::AutoH2oGAMMultiClass(
  data,
  TrainOnFull = FALSE,
  ValidationData = NULL,
  TestData = NULL,
  TargetColumnName = "Adrian",
  FeatureColNames = names(data)[!names(data) %in% c("IDcol_1", "IDcol_2","Adrian")],
  WeightsColumn = NULL,
  GamColNames = GamCols,
  eval_metric = "logloss",
  MaxMem = {gc();paste0(as.character(floor(as.numeric(system("awk '/MemFree/ {print $2}' /proc/meminfo", intern=TRUE)) / 1000000)),"G")},
  NThreads = max(1, parallel::detectCores()-2),
  model_path = normalizePath("./"),
  metadata_path = NULL,
  ModelID = "FirstModel",
  ReturnModelObjects = TRUE,
  SaveModelObjects = FALSE,
  IfSaveModel = "mojo",
  H2OShutdown = FALSE,
  H2OStartUp = TRUE,

  # ML args
  num_knots = NULL,
  keep_gam_cols = TRUE,
  GridTune = FALSE,
  GridStrategy = "Cartesian",
  StoppingRounds = 10,
  MaxRunTimeSecs = 3600 * 24 * 7,
  MaxModelsInGrid = 10,
  Distribution = "multinomial",
  Link = "Family_Default",
  Solver = "AUTO",
  Alpha = NULL,
  Lambda = NULL,
  LambdaSearch = FALSE,
  NLambdas = -1,
  Standardize = TRUE,
  RemoveCollinearColumns = FALSE,
  InterceptInclude = TRUE,
  NonNegativeCoefficients = FALSE)
The Auto_MultiClass() models handle a multitude of tasks. In order:
- Convert your data to data.table format for faster processing
- Create train, validation, and test data if you didn't supply those directly to the function
- Consoldate columns that are used for modeling and what is to be kept for data returned
- Dichotomize categorical variables (for AutoXGBoostRegression) and save the factor levels for scoring in a way that guarentees consistency across training, validation, and test data sets
- Saves the final column names for modeling to a csv for later reference
- Ensures the target levels are consistent across train, validate, and test sets and save the levels to file
- Handles the data conversion to the appropriate type, based on model type (CatBoost, H2O, and XGBoost)
- Multi-armed bandit hyperparameter tuning using randomized probability matching, if you choose to grid tune
- Build the grid tuned models
- Collect the evaluation metrics for each grid tune run
- Identify the best model of the set of models built in the grid tuning setup
- Save the hyperparameters from the winning grid tuned model
- Build the final model based on the best model from the grid tuning model search
- Collect evaluation metrics based on performance on test data
- Store the final predictions with the associated test data and other columns you want included in that set
- Generate and save Variable Importance data
- Return all the objects generated in a named list for immediate use
Generalized Hurdle Models
click to expand
First step is to build either a binary classification model (in the case of a single bucket value, such as zero) or a multiclass model (for the case of multiple bucket values, such as zero and 10). The next step is to subset the data for the cases of: less than the first split value, in between the first and second split value, second and third split value, ..., second to last and last split value, along with greater than last split value. For each data subset, a regression model is built for predicting values in the split value ranges. The final compilation is to multiply the probabilities of being in each group times the values supplied by the regression values for each group.
Single Partition
- E(y|xi) = Pr(X = 0) * 0 + Pr(X > 0) * E(X | X >= 0)
- E(y|xi) = Pr(X < x1) * E(X | X < x1) + Pr(X >= x1) * E(X | X >= x1)
Multiple Partitions
- E(y|xi) = Pr(X = 0) * 0 + Pr(X < x2) * E(X | X < x2) + ... + Pr(X < xn) * E(X | X < xn) + Pr(X >= xn) * E(X | X >= xn)
- E(y|xi) = Pr(X < x1) * E(X | X < x1) + Pr(x1 <= X < x2) * E(X | x1 <= X < x2) + ... + Pr(xn-1 <= X < xn) * E(X | xn-1 <= X < xn) + Pr(X >= xn) * E(X | X >= xn)
AutoCatBoostHurdleModel()
AutoCatBoostHurdleModel() utilizes the CatBoost algorithm on the backend.
AutoXGBoostHurdleModel()
AutoXGBoostHurdleModel() utilizes the XGBoost algorithm on the backend.
AutoH2oDRFHurdleModel()
AutoH2oDRFHurdleModel() utilizes the H2O distributed random forest algorithm on the backend.
AutoH2oGBMHurdleModel()
AutoH2oGBMHurdleModel() utilizes the H2O gradient boosting machine algorithm on the backend.
Nonlinear Regression Modeling
click to expand
AutoNLS()

AutoNLS() is an automated nonlinear regression modeling function. This function automatically finds the best model fit from the set of models listed below and merges predictions to source data file. Great for forecasting growth (extrapolation) when domain knowledge can guide model selection.
- Models included:
- Asymptotic
- Asymptotic through origin
- Asymptotic with offset
- Bi-exponential
- Four parameter logistic
- Three parameter logistic
- Gompertz
- Michal Menton
- Weibull
- Polynomial regression or monotonic regression
Model Scoring 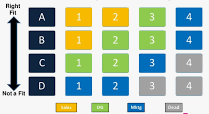

Expand to view content
Code Example
# Create some dummy correlated data
data <- RemixAutoML::FakeDataGenerator(
  Correlation = 0.85,
  N = 10000,
  ID = 2,
  ZIP = 0,
  AddDate = FALSE,
  Classification = FALSE,
  MultiClass = FALSE)

# Train a Multiple Regression Model (two target variables)
TestModel <- RemixAutoML::AutoCatBoostRegression(

  # GPU or CPU and the number of available GPUs
  task_type = "GPU",
  NumGPUs = 1,

  # Metadata arguments
  ModelID = "Test_Model_1",
  model_path = normalizePath("./"),
  metadata_path = NULL,
  SaveModelObjects = FALSE,
  ReturnModelObjects = TRUE,

  # Data arguments
  data = data,
  TrainOnFull = FALSE,
  ValidationData = NULL,
  TestData = NULL,
  Weights = NULL,
  DummifyCols = FALSE,
  TargetColumnName = c("Adrian","Independent_Variable1"),
  FeatureColNames = names(data)[!names(data) %in%
    c("IDcol_1","IDcol_2","Adrian")],
  PrimaryDateColumn = NULL,
  IDcols = c("IDcol_1","IDcol_2"),
  TransformNumericColumns = NULL,
  Methods = c("BoxCox","Asinh","Asin","Log","LogPlus1",
    "Logit","YeoJohnson"),

  # Model evaluation
  eval_metric = "MultiRMSE",
  eval_metric_value = 1.5,
  loss_function = "MultiRMSE",
  loss_function_value = 1.5,
  MetricPeriods = 10L,
  NumOfParDepPlots = ncol(data)-1L-2L,
  EvalPlots = TRUE,

  # Grid tuning
  PassInGrid = NULL,
  GridTune = FALSE,
  MaxModelsInGrid = 100L,
  MaxRunsWithoutNewWinner = 100L,
  MaxRunMinutes = 60*60,
  Shuffles = 4L,
  BaselineComparison = "default",

  # ML Args
  langevin = TRUE,
  diffusion_temperature = 10000,
  Trees = 250,
  Depth = 6,
  L2_Leaf_Reg = 3.0,
  RandomStrength = 1,
  BorderCount = 128,
  LearningRate = seq(0.01,0.10,0.01),
  RSM = c(0.80, 0.85, 0.90, 0.95, 1.0),
  BootStrapType = c("Bayesian","Bernoulli","Poisson","MVS","No"),
  GrowPolicy = c("SymmetricTree", "Depthwise", "Lossguide"))

# Output
TestModel$Model
TestModel$ValidationData
TestModel$EvaluationPlot
TestModel$EvaluationBoxPlot
TestModel$EvaluationMetrics
TestModel$VariableImportance
TestModel$InteractionImportance
TestModel$ShapValuesDT
TestModel$VI_Plot
TestModel$PartialDependencePlots
TestModel$PartialDependenceBoxPlots
TestModel$GridList
TestModel$ColNames
TestModel$TransformationResults

# Score a multiple regression model
Preds <- RemixAutoML::AutoCatBoostScoring(
  TargetType = "multiregression",
  ScoringData = data,
  FeatureColumnNames = names(data)[!names(data) %in%
    c("IDcol_1", "IDcol_2","Adrian")],
  FactorLevelsList = TestModel$FactorLevelsList,
  IDcols = c("IDcol_1","IDcol_2"),
  OneHot = FALSE,
  ReturnShapValues = TRUE,
  ModelObject = TestModel$Model,
  ModelPath = NULL, #normalizePath("./"),
  ModelID = "Test_Model_1",
  ReturnFeatures = TRUE,
  MultiClassTargetLevels = NULL,
  TransformNumeric = FALSE,
  BackTransNumeric = FALSE,
  TargetColumnName = NULL,
  TransformationObject = NULL,
  TransID = NULL,
  TransPath = NULL,
  MDP_Impute = TRUE,
  MDP_CharToFactor = TRUE,
  MDP_RemoveDates = TRUE,
  MDP_MissFactor = "0",
  MDP_MissNum = -1,
  RemoveModel = FALSE)
AutoCatBoostScoring()
AutoCatBoostScoring() is an automated scoring function that compliments the AutoCatBoost() model training functions. This function requires you to supply features for scoring. It will run ModelDataPrep() to prepare your features for catboost data conversion and scoring. It will also handle and transformations and back-transformations if you utilized that feature in the regression training case.
AutoXGBoostScoring()
AutoXGBoostScoring() is an automated scoring function that compliments the AutoXGBoost() model training functions. This function requires you to supply features for scoring. It will run ModelDataPrep() and the DummifyDT() functions to prepare your features for xgboost data conversion and scoring. It will also handle and transformations and back-transformations if you utilized that feature in the regression training case.
AutoH2OMLScoring()
AutoH2OMLScoring() is an automated scoring function that compliments the AutoH2oGBM__() and AutoH2oDRF__() model training functions. This function requires you to supply features for scoring. It will run ModelDataPrep()to prepare your features for H2O data conversion and scoring. It will also handle transformations and back-transformations if you utilized that feature in the regression training case and didn't do it yourself before hand.
AutoHurdleScoring()
AutoHurdleScoring() will score the AutoCatBoostHurdleModel() function currently. Functionality for XGBoost hurdle models will be next, followed by the H2O version.
Model Evaluation 

Expand to view content
RemixClassificationMetrics()
RemixClassificationMetrics() will return all confusion matrix metrics across all possible thresholds (seq(0.01,0.99,0.01) for any Remix Auto_Classification() model. Cost sensitive thresholds are also returned.
ParDepCalPlots()
ParDepCalPlots() is for visualizing the relationships of features and the reliability of the model in predicting those effects. Build a partial dependence calibration line plot, box plot or bar plot for the case of categorical variables.

EvalPlot()
EvalPlot() Has two plot versions: calibration line plot of predicted values and actual values across range of predicted value, and calibration boxplot for seeing the accuracy and variability of predictions against actuals.

threshOptim()
threshOptim() is great for situations with asymmetric costs across the confusion matrix. Generate a cost-sensitive optimized threshold for classification models. Just supply the costs for false positives and false negatives (can supply costs for all four outcomes too) and the function will return the optimal threshold for maximizing "utility".
RedYellowGreen()
RedYellowGreen() computes optimal thresholds for binary classification models where "don't classify" is an option. Consider a health care binary classification model that predicts whether or not a disease is present. This is certainly a case for threshOptim since the costs of false positives and false negatives can vary by a large margin. However, there is always the potential to run further analysis. The RedYellowGreen() function can compute two thresholds if you can supply a cost of "further analysis". Predicted values < the lower threshold are confidently classified as a negative case and predicted values > the upper threshold are confidently classified as a postive case. Predicted values in between the lower and upper thresholds are cases that should require further analysis.

Panel Data Forecasting 

Expand to view content
Code Example: AutoCatBoostCARMA()
# @@@@@@@@@@@@@@@@@@@@@@@@@@@@@@@@@@@@@@@@@@@@@@@@@@@@@@@@@@@@@@@@@@@@@@@@
# Out-of-Sample Feature + Grid Tuning of RemixAutoML::AutoCatBoostCARMA()
# @@@@@@@@@@@@@@@@@@@@@@@@@@@@@@@@@@@@@@@@@@@@@@@@@@@@@@@@@@@@@@@@@@@@@@@@

# Set up your output file path for saving results as a .csv
Path <- "C:/YourPathHere"

# Run on GPU or CPU (some options in the grid tuning force usage of CPU for some runs)
TaskType = "GPU"

# Define number of CPU threads to allow data.table to utilize
data.table::setDTthreads(percent = max(1L, parallel::detectCores()-2L))

# Load data
data <- data <- data.table::fread("https://www.dropbox.com/s/2str3ek4f4cheqi/walmart_train.csv?dl=1")

# Ensure series have no missing dates (also remove series with more than 25% missing values)
data <- RemixAutoML::TimeSeriesFill(
  data,
  DateColumnName = "Date",
  GroupVariables = c("Store","Dept"),
  TimeUnit = "weeks",
  FillType = "maxmax",
  MaxMissingPercent = 0.25,
  SimpleImpute = TRUE)

# Set negative numbers to 0
data <- data[, Weekly_Sales := data.table::fifelse(Weekly_Sales < 0, 0, Weekly_Sales)]

# Remove IsHoliday column
data[, IsHoliday := NULL]

# Create xregs (this is the include the categorical variables instead of utilizing only the interaction of them)
xregs <- data[, .SD, .SDcols = c("Date", "Store", "Dept")]

# Change data types
data[, ":=" (Store = as.character(Store), Dept = as.character(Dept))]
xregs[, ":=" (Store = as.character(Store), Dept = as.character(Dept))]

# Subset data so we have an out of time sample
data1 <- data.table::copy(data[, ID := 1L:.N, by = c("Store","Dept")][ID <= 125L][, ID := NULL])
data[, ID := NULL]

# Define values for SplitRatios and FCWindow Args
N1 <- data1[, .N, by = c("Store","Dept")][1L, N]
N2 <- xregs[, .N, by = c("Store","Dept")][1L, N]

# Setup Grid Tuning & Feature Tuning data.table using a cross join of vectors
Tuning <- data.table::CJ(
  TimeWeights = c("None",0.999),
  MaxTimeGroups = c("weeks","months"),
  TargetTransformation = c("TRUE","FALSE"),
  Difference = c("TRUE","FALSE"),
  HoldoutTrain = c(6,18),
  Langevin = c("TRUE","FALSE"),
  NTrees = c(2500,5000),
  Depth = c(6,9),
  RandomStrength = c(0.75,1),
  L2_Leaf_Reg = c(3.0,4.0),
  RSM = c(0.75,"NULL"),
  GrowPolicy = c("SymmetricTree","Lossguide","Depthwise"),
  BootStrapType = c("Bayesian","MVS","No"))

# Remove options that are not compatible with GPU (skip over this otherwise)
Tuning <- Tuning[Langevin == "TRUE" | (Langevin == "FALSE" & RSM == "NULL" & BootStrapType %in% c("Bayesian","No"))]

# Randomize order of Tuning data.table
Tuning <- Tuning[order(runif(.N))]

# Load grid results and remove rows that have already been tested
if(file.exists(file.path(Path, "Walmart_CARMA_Metrics.csv"))) {
  Metrics <- data.table::fread(file.path(Path, "Walmart_CARMA_Metrics.csv"))
  temp <- data.table::rbindlist(list(Metrics,Tuning), fill = TRUE)
  temp <- unique(temp, by = c(4:(ncol(temp)-1)))
  Tuning <- temp[is.na(RunTime)][, .SD, .SDcols = names(Tuning)]
  rm(Metrics,temp)
}

# Define the total number of runs
TotalRuns <- Tuning[,.N]

# Kick off feature + grid tuning
for(Run in seq_len(TotalRuns)) {

  # Print run number
  for(zz in seq_len(100)) print(Run)

  # Use fresh data for each run
  xregs_new <- data.table::copy(xregs)
  data_new <- data.table::copy(data1)

  # Timer start
  StartTime <- Sys.time()

  # Run carma system
  CatBoostResults <- RemixAutoML::AutoCatBoostCARMA(

    # data args
    data = data_new,
    TimeWeights = if(Tuning[Run, TimeWeights] == "None") NULL else as.numeric(Tuning[Run, TimeWeights]),
    TargetColumnName = "Weekly_Sales",
    DateColumnName = "Date",
    HierarchGroups = NULL,
    GroupVariables = c("Store","Dept"),
    TimeUnit = "weeks",
    TimeGroups = if(Tuning[Run, MaxTimeGroups] == "weeks") "weeks" else if(Tuning[Run, MaxTimeGroups] == "months") c("weeks","months") else c("weeks","months","quarters"),

    # Production args
    TrainOnFull = TRUE,
    SplitRatios = c(1 - Tuning[Run, HoldoutTrain] / N2, Tuning[Run, HoldoutTrain] / N2),
    PartitionType = "random",
    FC_Periods = N2-N1,
    TaskType = TaskType,
    NumGPU = 1,
    Timer = TRUE,
    DebugMode = TRUE,

    # Target variable transformations
    TargetTransformation = as.logical(Tuning[Run, TargetTransformation]),
    Methods = c("BoxCox","Asinh","Log","LogPlus1","YeoJohnson"),
    Difference = as.logical(Tuning[Run, Difference]),
    NonNegativePred = TRUE,
    RoundPreds = FALSE,

    # Calendar-related features
    CalendarVariables = c("week","wom","month","quarter"),
    HolidayVariable = c("USPublicHolidays"),
    HolidayLookback = NULL,
    HolidayLags = c(1,2,3),
    HolidayMovingAverages = c(2,3),

    # Lags, moving averages, and other rolling stats
    Lags = if(Tuning[Run, MaxTimeGroups] == "weeks") c(1,2,3,4,5,8,9,12,13,51,52,53) else if(Tuning[Run, MaxTimeGroups] == "months") list("weeks" = c(1,2,3,4,5,8,9,12,13,51,52,53), "months" = c(1,2,6,12)) else list("weeks" = c(1,2,3,4,5,8,9,12,13,51,52,53), "months" = c(1,2,6,12), "quarters" = c(1,2,3,4)),
    MA_Periods = if(Tuning[Run, MaxTimeGroups] == "weeks") c(2,3,4,5,8,9,12,13,51,52,53) else if(Tuning[Run, MaxTimeGroups] == "months") list("weeks" = c(2,3,4,5,8,9,12,13,51,52,53), "months" = c(2,6,12)) else list("weeks" = c(2,3,4,5,8,9,12,13,51,52,53), "months" = c(2,6,12), "quarters" = c(2,3,4)),
    SD_Periods = NULL,
    Skew_Periods = NULL,
    Kurt_Periods = NULL,
    Quantile_Periods = NULL,
    Quantiles_Selected = NULL,

    # Bonus features
    AnomalyDetection = NULL,
    XREGS = xregs_new,
    FourierTerms = 0,
    TimeTrendVariable = TRUE,
    ZeroPadSeries = NULL,
    DataTruncate = FALSE,

    # ML grid tuning args
    GridTune = FALSE,
    PassInGrid = NULL,
    ModelCount = 5,
    MaxRunsWithoutNewWinner = 50,
    MaxRunMinutes = 60*60,

    # ML evaluation output
    PDFOutputPath = NULL,
    SaveDataPath = NULL,
    NumOfParDepPlots = 0L,

    # ML loss functions
    EvalMetric = "RMSE",
    EvalMetricValue = 1,
    LossFunction = "RMSE",
    LossFunctionValue = 1,

    # ML tuning args
    NTrees = Tuning[Run, NTrees],
    Depth = Tuning[Run, Depth],
    L2_Leaf_Reg = Tuning[Run, L2_Leaf_Reg],
    LearningRate = 0.03,
    Langevin = as.logical(Tuning[Run, Langevin]),
    DiffusionTemperature = 10000,
    RandomStrength = Tuning[Run, RandomStrength],
    BorderCount = 254,
    RSM = if(Tuning[Run, RSM] == "NULL") NULL else as.numeric(Tuning[Run, RSM]),
    GrowPolicy = Tuning[Run, GrowPolicy],
    BootStrapType = Tuning[Run, BootStrapType],
    ModelSizeReg = 0.5,
    FeatureBorderType = "GreedyLogSum",
    SamplingUnit = "Group",
    SubSample = NULL,
    ScoreFunction = "Cosine",
    MinDataInLeaf = 1)

  # Timer End
  EndTime <- Sys.time()

  # Prepare data for evaluation
  Results <- CatBoostResults$Forecast
  data.table::setnames(Results, "Weekly_Sales", "bla")
  Results <- merge(Results, data, by = c("Store","Dept","Date"), all = FALSE)
  Results <- Results[is.na(bla)][, bla := NULL]

  # Create totals and subtotals
  Results <- data.table::groupingsets(
    x = Results,
    j = list(Predictions = sum(Predictions), Weekly_Sales = sum(Weekly_Sales)),
    by = c("Date", "Store", "Dept"),
    sets = list(c("Date", "Store", "Dept"), c("Store", "Dept"), "Store", "Dept", "Date"))

  # Fill NAs with "Total" for totals and subtotals
  for(cols in c("Store","Dept")) Results[, eval(cols) := data.table::fifelse(is.na(get(cols)), "Total", get(cols))]

  # Add error measures
  Results[, Weekly_MAE := abs(Weekly_Sales - Predictions)]
  Results[, Weekly_MAPE := Weekly_MAE / Weekly_Sales]

  # Weekly results
  Weekly_MAPE <- Results[, list(Weekly_MAPE = mean(Weekly_MAPE)), by = list(Store,Dept)]

  # Monthly results
  temp <- data.table::copy(Results)
  temp <- temp[, Date := lubridate::floor_date(Date, unit = "months")]
  temp <- temp[, lapply(.SD, sum), by = c("Date","Store","Dept"), .SDcols = c("Predictions", "Weekly_Sales")]
  temp[, Monthly_MAE := abs(Weekly_Sales - Predictions)]
  temp[, Monthly_MAPE := Monthly_MAE / Weekly_Sales]
  Monthly_MAPE <- temp[, list(Monthly_MAPE = mean(Monthly_MAPE)), by = list(Store,Dept)]

  # Collect metrics for Total (feel free to switch to something else or no filter at all)
  Metrics <- data.table::data.table(
    RunNumber = Run,
    Total_Weekly_MAPE = Weekly_MAPE[Store == "Total" & Dept == "Total", Weekly_MAPE],
    Total_Monthly_MAPE = Monthly_MAPE[Store == "Total" & Dept == "Total", Monthly_MAPE],
    Tuning[Run],
    RunTime = EndTime - StartTime)

  # Append to file (not overwrite)
  data.table::fwrite(Metrics, file = file.path(Path, "Walmart_CARMA_Metrics.csv"), append = TRUE)

  # Remove objects (clear space before new runs)
  rm(CatBoostResults, Results, temp, Weekly_MAE, Weekly_MAPE, Monthly_MAE, Monthly_MAPE)

  # Garbage collection because of GPU
  gc()
}
Code Example: AutoCatBoostVectorCARMA()
# @@@@@@@@@@@@@@@@@@@@@@@@@@@@@@@@@@@@@@@@@@@@@@@
# ML-Based Vector AutoRegression CARMA ----
# @@@@@@@@@@@@@@@@@@@@@@@@@@@@@@@@@@@@@@@@@@@@@@@

# Load Walmart Data from Dropbox----
data <- data.table::fread(
 "https://www.dropbox.com/s/2str3ek4f4cheqi/walmart_train.csv?dl=1")

# Filter out zeros
data <- data[Weekly_Sales != 0]

# Subset for Stores / Departments With Full Series
data <- data[, Counts := .N, by = c("Store","Dept")][Counts == 143][
 , Counts := NULL]

# Subset Columns (remove IsHoliday column)----
keep <- c("Store","Dept","Date","Weekly_Sales")
data <- data[, ..keep]
data <- data[Store %in% c(1,2)]
xregs <- data.table::copy(data)
xregs[, GroupVar := do.call(paste, c(.SD, sep = " ")), .SDcols = c("Store","Dept")]
xregs[, c("Store","Dept") := NULL]
data.table::setnames(xregs, "Weekly_Sales", "Other")
xregs[, Other := jitter(Other, factor = 25)]
data <- data[as.Date(Date) < as.Date('2012-09-28')]

#  Vector CARMA testingdata[, Weekly_Profit := Weekly_Sales * 0.75]

# Build forecast
CatBoostResults <- RemixAutoML::AutoCatBoostVectorCARMA(

  # data args
  data = data, # TwoGroup_Data,
  TimeWeights = NULL,
  TargetColumnName = c("Weekly_Sales","Weekly_Profit"),
  DateColumnName = "Date",
  HierarchGroups = NULL,
  GroupVariables = c("Store","Dept"),
  TimeUnit = "weeks",
  TimeGroups = c("weeks","months"),

  # Production args
  TrainOnFull = TRUE,
  SplitRatios = c(1 - 10 / 138, 10 / 138),
  PartitionType = "random",
  FC_Periods = 4,
  Timer = TRUE,
  DebugMode = TRUE,

  # Target transformations
  TargetTransformation = TRUE,
  Methods = c("BoxCox", "Asinh", "Asin", "Log",
              "LogPlus1", "Logit", "YeoJohnson"),
  Difference = FALSE,
  NonNegativePred = FALSE,
  RoundPreds = FALSE,

  # Date features
  CalendarVariables = c("week", "month", "quarter"),
  HolidayVariable = c("USPublicHolidays",
                      "EasterGroup",
                      "ChristmasGroup","OtherEcclesticalFeasts"),
  HolidayLookback = NULL,
  HolidayLags = 1,
  HolidayMovingAverages = 1:2,

  # Time series features
  Lags = list("weeks" = seq(2L, 10L, 2L),
              "months" = c(1:3)),
  MA_Periods = list("weeks" = seq(2L, 10L, 2L),
                    "months" = c(2,3)),
  SD_Periods = NULL,
  Skew_Periods = NULL,
  Kurt_Periods = NULL,
  Quantile_Periods = NULL,
  Quantiles_Selected = c("q5","q95"),

  # Bonus features
  AnomalyDetection = NULL,
  XREGS = xregs,
  FourierTerms = 2,
  TimeTrendVariable = TRUE,
  ZeroPadSeries = NULL,
  DataTruncate = FALSE,

  # ML Args
  NumOfParDepPlots = 100L,
  EvalMetric = "MultiRMSE",
  EvalMetricValue = 1.5,
  LossFunction = "MultiRMSE",
  LossFunctionValue = 1.5,
  GridTune = FALSE,
  PassInGrid = NULL,
  ModelCount = 5,
  TaskType = "GPU",
  NumGPU = 1,
  MaxRunsWithoutNewWinner = 50,
  MaxRunMinutes = 60*60,
  Langevin = FALSE,
  DiffusionTemperature = 10000,
  NTrees = 2500,
  L2_Leaf_Reg = 3.0,
  RandomStrength = 1,
  BorderCount = 254,
  BootStrapType = c("Bayesian", "Bernoulli", "Poisson", "MVS", "No"),
  Depth = 6)
Code Example: AutoCatBoostHurdleCARMA()
# @@@@@@@@@@@@@@@@@@@@@@@@@@@@@@@
# Intermittent Demand CARMA ----
# @@@@@@@@@@@@@@@@@@@@@@@@@@@@@@@

# Load Walmart Data from Dropbox----
data <- data.table::fread("https://www.dropbox.com/s/2str3ek4f4cheqi/walmart_train.csv?dl=1")

 # Subset for Stores / Departments With Full Series
data <- data[, Counts := .N, by = c("Store","Dept")][
  Counts == 143][
    , Counts := NULL]

# Subset Columns (remove IsHoliday column)----
keep <- c("Store","Dept","Date","Weekly_Sales")
data <- data[, ..keep]
data <- data[Store %in% c(1,2)]
xregs <- data.table::copy(data)
xregs[, GroupVar := do.call(paste, c(.SD, sep = " ")), .SDcols = c("Store","Dept")]
xregs[, c("Store","Dept") := NULL]
data.table::setnames(xregs, "Weekly_Sales", "Other")
xregs[, Other := jitter(Other, factor = 25)]
data <- data[as.Date(Date) < as.Date('2012-09-28')]

# Add some zeros for testing
data[runif(.N) < 0.25, Weekly_Sales := 0]

# Build Forecast ----
Output <- RemixAutoML::AutoCatBoostHurdleCARMA(

  # data args
  AlgoType = "catboost",
  data = data,
  TargetColumnName = "Weekly_Sales",
  DateColumnName = "Date",
  HierarchGroups = NULL,
  GroupVariables = c("Store","Dept"),
  TimeUnit = "weeks",
  TimeGroups = c("weeks","months"),

  # Production args
  TrainOnFull = TRUE,
  SplitRatios = c(1 - 10 / 138, 10 / 138),
  PartitionType = "random",
  FC_Periods = 4,
  Timer = TRUE,
  DebugMode = TRUE,

  # Target transformations
  TargetTransformation = FALSE,
  Methods = c("BoxCox","Asinh","Asin","Log","LogPlus1","Logit","YeoJohnson"),
  Difference = FALSE,
  NonNegativePred = FALSE,
  RoundPreds = FALSE,

  # Date features
  CalendarVariables = c("week","month","quarter"),
  HolidayVariable = c("USPublicHolidays","EasterGroup","ChristmasGroup","OtherEcclesticalFeasts"),
  HolidayLookback = NULL,
  HolidayLags = 1,
  HolidayMovingAverages = 1:2,

  # Time series features
  Lags = list("weeks" = seq(2L,10L,2L), "months" = c(1:3)),
  MA_Periods = list("weeks" = seq(2L,10L,2L), "months" = c(2,3)),
  SD_Periods = NULL,
  Skew_Periods = NULL,
  Kurt_Periods = NULL,
  Quantile_Periods = NULL,
  Quantiles_Selected = NULL,

  # Bonus features
  AnomalyDetection = NULL,
  XREGS = xregs,
  FourierTerms = 1,
  TimeTrendVariable = TRUE,
  ZeroPadSeries = NULL,
  DataTruncate = FALSE,

  # ML Args
  NumOfParDepPlots = 100L,
  EvalMetric = "RMSE",
  GridTune = FALSE,
  PassInGrid = NULL,
  ModelCount = 5,
  TaskType = "GPU",
  NumGPU = 1,
  MaxRunsWithoutNewWinner = 50,
  MaxRunMinutes = 60*60,
  NTrees = 1000,
  L2_Leaf_Reg = 3.0,
  RandomStrength = 1,
  BorderCount = 254,
  BootStrapType = c("Bayesian", "Bernoulli", "Poisson", "MVS", "No"),
  Depth = 6)
Code Example: AutoXGBoostCARMA()
# @@@@@@@@@@@@@@@@@@@@@@@@@@@@@@@
# XGBoost Version ----
# @@@@@@@@@@@@@@@@@@@@@@@@@@@@@@@

# Load data
data <- data.table::fread("https://www.dropbox.com/s/2str3ek4f4cheqi/walmart_train.csv?dl=1")

# Ensure series have no missing dates (also remove series with more than 25% missing values)
data <- RemixAutoML::TimeSeriesFill(
  data,
  DateColumnName = "Date",
  GroupVariables = c("Store","Dept"),
  TimeUnit = "weeks",
  FillType = "maxmax",
  MaxMissingPercent = 0.25,
  SimpleImpute = TRUE)

# Set negative numbers to 0
data <- data[, Weekly_Sales := data.table::fifelse(Weekly_Sales < 0, 0, Weekly_Sales)]

# Remove IsHoliday column
data[, IsHoliday := NULL]

# Create xregs (this is the include the categorical variables instead of utilizing only the interaction of them)
xregs <- data[, .SD, .SDcols = c("Date", "Store", "Dept")]

# Change data types
data[, ":=" (Store = as.character(Store), Dept = as.character(Dept))]
xregs[, ":=" (Store = as.character(Store), Dept = as.character(Dept))]

 # Build forecast
XGBoostResults <- AutoXGBoostCARMA(

  # Data Artifacts
  data = data,
  NonNegativePred = FALSE,
  RoundPreds = FALSE,
  TargetColumnName = "Weekly_Sales",
  DateColumnName = "Date",
  HierarchGroups = NULL,
  GroupVariables = c("Store","Dept"),
  TimeUnit = "weeks",
  TimeGroups = c("weeks","months"),

  # Data Wrangling Features
  ZeroPadSeries = NULL,
  DataTruncate = FALSE,
  SplitRatios = c(1 - 10 / 138, 10 / 138),
  PartitionType = "timeseries",
  AnomalyDetection = NULL,

  # Productionize
  FC_Periods = 0,
  TrainOnFull = FALSE,
  NThreads = 8,
  Timer = TRUE,
  DebugMode = FALSE,
  SaveDataPath = NULL,
  PDFOutputPath = NULL,

  # Target Transformations
  TargetTransformation = TRUE,
  Methods = c("BoxCox", "Asinh", "Asin", "Log", "LogPlus1", "Sqrt", "Logit","YeoJohnson"),
  Difference = FALSE,

  # Features
  Lags = list("weeks" = seq(1L, 10L, 1L), "months" = seq(1L, 5L, 1L)),
  MA_Periods = list("weeks" = seq(5L, 20L, 5L), "months" = seq(2L, 10L, 2L)),
  SD_Periods = NULL,
  Skew_Periods = NULL,
  Kurt_Periods = NULL,
  Quantile_Periods = NULL,
  Quantiles_Selected = c("q5","q95"),
  XREGS = xregs,
  FourierTerms = 4,
  CalendarVariables = c("week", "wom", "month", "quarter"),
  HolidayVariable = c("USPublicHolidays","EasterGroup","ChristmasGroup","OtherEcclesticalFeasts"),
  HolidayLookback = NULL,
  HolidayLags = 1,
  HolidayMovingAverages = 1:2,
  TimeTrendVariable = TRUE,

  # ML eval args
  TreeMethod = "hist",
  EvalMetric = "RMSE",
  LossFunction = 'reg:squarederror',

  # ML grid tuning
  GridTune = FALSE,
  ModelCount = 5,
  MaxRunsWithoutNewWinner = 20L,
  MaxRunMinutes = 24L*60L,

  # ML args
  NTrees = 300,
  LearningRate = 0.3,
  MaxDepth = 9L,
  MinChildWeight = 1.0,
  SubSample = 1.0,
  ColSampleByTree = 1.0)
Code Example: AutoH2OCARMA()
# @@@@@@@@@@@@@@@@@@@@@@@@@@@@@@@
# H2O Version ----
# @@@@@@@@@@@@@@@@@@@@@@@@@@@@@@@

# Load data
data <- data.table::fread("https://www.dropbox.com/s/2str3ek4f4cheqi/walmart_train.csv?dl=1")

# Ensure series have no missing dates (also remove series with more than 25% missing values)
data <- RemixAutoML::TimeSeriesFill(
  data,
  DateColumnName = "Date",
  GroupVariables = c("Store","Dept"),
  TimeUnit = "weeks",
  FillType = "maxmax",
  MaxMissingPercent = 0.25,
  SimpleImpute = TRUE)

# Set negative numbers to 0
data <- data[, Weekly_Sales := data.table::fifelse(Weekly_Sales < 0, 0, Weekly_Sales)]

# Remove IsHoliday column
data[, IsHoliday := NULL]

# Create xregs (this is the include the categorical variables instead of utilizing only the interaction of them)
xregs <- data[, .SD, .SDcols = c("Date", "Store", "Dept")]

# Change data types
data[, ":=" (Store = as.character(Store), Dept = as.character(Dept))]
xregs[, ":=" (Store = as.character(Store), Dept = as.character(Dept))]

# Build forecast
Results <- RemixAutoML::AutoH2OCARMA(

  # Data Artifacts
  AlgoType = "drf",
  ExcludeAlgos = NULL,
  data = data,
  TargetColumnName = "Weekly_Sales",
  DateColumnName = "Date",
  HierarchGroups = NULL,
  GroupVariables = c("Dept"),
  TimeUnit = "week",
  TimeGroups = c("weeks","months"),

  # Data Wrangling Features
  SplitRatios = c(1 - 10 / 138, 10 / 138),
  PartitionType = "random",

  # Production args
  FC_Periods = 4L,
  TrainOnFull = FALSE,
  MaxMem = {gc();paste0(as.character(floor(max(32, as.numeric(system("awk '/MemFree/ {print $2}' /proc/meminfo", intern=TRUE)) -32) / 1000000)),"G")},
  NThreads = parallel::detectCores(),
  PDFOutputPath = NULL,
  SaveDataPath = NULL,
  Timer = TRUE,
  DebugMode = TRUE,

  # Target Transformations
  TargetTransformation = FALSE,
  Methods = c("BoxCox", "Asinh", "Asin", "Log",
    "LogPlus1", "Sqrt", "Logit", "YeoJohnson"),
  Difference = FALSE,
  NonNegativePred = FALSE,
  RoundPreds = FALSE,

  # Calendar features
  CalendarVariables = c("week", "wom", "month", "quarter", "year"),
  HolidayVariable = c("USPublicHolidays","EasterGroup",
    "ChristmasGroup","OtherEcclesticalFeasts"),
  HolidayLookback = NULL,
  HolidayLags = 1:7,
  HolidayMovingAverages = 2:7,
  TimeTrendVariable = TRUE,

  # Time series features
  Lags = list("weeks" = c(1:4), "months" = c(1:3)),
  MA_Periods = list("weeks" = c(2:8), "months" = c(6:12)),
  SD_Periods = NULL,
  Skew_Periods = NULL,
  Kurt_Periods = NULL,
  Quantile_Periods = NULL,
  Quantiles_Selected = NULL,

  # Bonus Features
  XREGS = NULL,
  FourierTerms = 2L,
  AnomalyDetection = NULL,
  ZeroPadSeries = NULL,
  DataTruncate = FALSE,

  # ML evaluation args
  EvalMetric = "RMSE",
  NumOfParDepPlots = 0L,

  # ML grid tuning args
  GridTune = FALSE,
  GridStrategy = "Cartesian",
  ModelCount = 5,
  MaxRuntimeSecs = 60*60*24,
  StoppingRounds = 10,

  # ML Args
  NTrees = 1000L,
  MaxDepth = 20,
  SampleRate = 0.632,
  MTries = -1,
  ColSampleRatePerTree = 1,
  ColSampleRatePerTreeLevel  = 1,
  MinRows = 1,
  NBins = 20,
  NBinsCats = 1024,
  NBinsTopLevel = 1024,
  HistogramType = "AUTO",
  CategoricalEncoding = "AUTO",
  RandomColNumbers = NULL,
  InteractionColNumbers = NULL,
  WeightsColumn = NULL,

  # ML args
  Distribution = "gaussian",
  Link = "identity",
  RandomDistribution = NULL,
  RandomLink = NULL,
  Solver = "AUTO",
  Alpha = NULL,
  Lambda = NULL,
  LambdaSearch = FALSE,
  NLambdas = -1,
  Standardize = TRUE,
  RemoveCollinearColumns = FALSE,
  InterceptInclude = TRUE,
  NonNegativeCoefficients = FALSE)

AutoCatBoostVectorCARMA For Panel Data with multiple series to forecast. An example would be, predicting revenue and transactions across a large number of stores over time.
AutoHurdleCARMA() utilizes the AutoCatBoostHurdleModel() function internally in order to model zeros that naturally show up in intermittent demand data sets.
AutoCatBoostCARMA() utilizes the CatBoost alorithm
AutoXGBoostCARMA() utilizes the XGBoost alorithm
AutoH2OCARMA() utilizes H2O Algorithms: RandomForest, GBM, GLM, AutoML, and GAM
Model Highlights
The CARMA suite utilizes several features to ensure proper models are built to generate the best possible out-of-sample forecasts.
Feature engineering: I use a time trend, calendar variables, holiday counts, differencing, along with fourier pairs and lags / rolling statistics (mean, sd, skewness, kurtosis, quantiles) and they can be generated by categorical variables and their interactions plus for various time-based aggregations. Internally, the CARMA functions utilize several RemixAutoML functions, all written using data.table for fast and memory efficient processing:
-
AutoLagRollStats()- creates lags and moving average features (also creates lags and moving averages off of time between records) -
AutoLagRollStatsScoring()- creates lags and moving average features for a single record (along with the time between vars) -
CreateCalendarVariables()- creates numeric features identifying various time units based on date columns -
CreateHolidayVariables()- creates count features based on the specified holiday groups you want to track and the date columns you supply -
AutoHierarchicalFourier()- creates fourier pairs, by group, in paralell, for group variables and their interactions -
DifferenceData()- differencing of the target variable for single series and panel data
Optimal transformations: the target variable along with the associated lags and moving average features were transformed. This is really useful for regression models with categorical features that have associated target values that significantly differ from each other. The transformation options that are tested (using a Pearson test for normality) include:
- YeoJohnson
- BoxCox
- Log
- LogPlus1
- Sqrt
- arcsinh
- Identity
- arcsin(sqrt(x)): proportion data only
- logit(x): proportion data only
The functions used to create these and generate them for scoring models come from RemixAutoML:
AutoTransformationCreate()AutoTransformationScore()
Models: there are four CARMA functions and each use a different algorithm for the model fitting. The models used to fit the time series data come from RemixAutoML and include:
AutoCatBoostRegression()AutoXGBoostRegression()AutoH2oDRFRegression()AutoH2oGBMRegression()AutoH2oGLMRegression()AutoH2oGAMRegression()AutoH2oAutoMLRegression()
GPU: With the CatBoost and XGBoost functions, you can build the models utilizing GPU (I run them with a GeForce 1080ti) which results in an average 10x speedup in model training time (compared to running on CPU with 8 threads).
Data partitioning: for creating the training, validation, and test data, the CARMA functions utilize the AutoDataPartition() function and utilizes the "timeseries" option for the PartitionType argument which ensures that the train data reflects the furthest points back in time, followed by the validation data, and then the test data which is the most recent in time.
Forecasting: Once the regression model is built, the forecast process replicates the ARIMA process. Once a single step-ahead forecast is made, the lags and moving average features are updated based on the predicted values from scoring the model. Next, the rest of the other features are updated. Then the next forecast step is made, rinse and repeat for remaining forecasting steps. This process utilizes the RemixAutoML functions:
AutoCatBoostScoring()AutoXGBoostScoring()AutoH2oMLScoring()
Intermittent Demand Forecasting Functions
TimeSeriesFill()
TimeSeriesFill() is a function that will zero pad (currently only zero pad) a time series data set (not transactional data). There are four ways to use this function:
Choose from:
- maxmax - Fill from the absolute min date to the absolute max date (single series and panel data)
- minmax - Fill from the max date of the min set to the absolute max date (panel data)
- maxmin - Fill from the absolute min date to the min of the max dates (panel data)
- minmin - Fill from the max date of the min dates to the min date of the max dates (panel data)
ContinuousTimeDataGenerator()
ContinuousTimeDataGenerator() is for frequency and size data sets. This function generates count and size data sets for intermittent demand forecasting, using the methods in this package.
AutoCatBoostSizeFreqDist()
AutoCatBoostSizeFreqDist() is for building size and frequency predictive distributions via quantile regressions. Size (or severity) and frequency (or count) quantile regressions are build and you supply the actual percentiles you want predicted. Use this with the ID_SingleLevelGibbsSampler() function to simulate from the joint distribution.
AutoH2oGBMSizeFreqDist()
AutoH2oGBMSizeFreqDist() is for building size and frequency predictive distributions via quantile regressions. Size (or severity) and frequency (or count) quantile regressions are build and you supply the actual percentiles you want predicted. Use this with the ID_SingleLevelGibbsSampler() function to simulate from the joint distribution.
AutoCatBoostFreqSizeScoring()
AutoCatBoostFreqSizeScoring() is for scoring the models build with AutoCatBoostSizeFreqDist(). It will return the predicted values for every quantile model for both distributions for 1 to the max forecast periods you provided to build the scoring data.
AutoH2oGBMFreqSizeScoring()
AutoH2oGBMFreqSizeScoring() is for scoring the models build with AutoH2oGBMSizeFreqDist(). It will return the predicted values for every quantile model for both distributions for 1 to the max forecast periods you provided to build the scoring data.
Time Series Forecasting 

Expand to view content
AutoBanditSarima()
Code Example
# Build model
data <- RemixAutoML::FakeDataGenerator(Correlation = 0.82, TimeSeries = TRUE, TimeSeriesTimeAgg = "1min")

# Run system
Output <- RemixAutoML::AutoBanditSarima(
  data = data,
  SaveFile = NULL,
  ByDataType = FALSE,
  TargetVariableName = "Weekly_Sales",
  DateColumnName = "Date",
  TimeAggLevel = "1min",
  EvaluationMetric = "MAE",
  NumHoldOutPeriods = 12L,
  NumFCPeriods = 16L,
  MaxLags = 10L,
  MaxSeasonalLags = 0L,
  MaxMovingAverages = 3L,
  MaxSeasonalMovingAverages = 0L,
  MaxFourierPairs = 2L,
  TrainWeighting = 0.50,
  MaxConsecutiveFails = 50L,
  MaxNumberModels = 100L,
  MaxRunTimeMinutes = 10L,
  NumberCores = 12,
  DebugMode = FALSE)

# View output
Output$ForecastPlot
Output$ErrorLagMA2x2
Output$Forecast
Output$PerformanceGrid
AutoBanditSarima() is the newest weapon in the time series arsenal. This is the highest performing single series time series model in the package. The entire arima parameter space is divided up into blocks that are increasing in complexity of parameter settings. The multi-armed bandit will determine which parameter block to sample from more frequently based on which one is performing better than the others. The underlying bandit algorithm is the randomized probability matching algorithm found in the bandit package. I had to write a slight variation of it to allow for tweaking the number of intervals used in computing the integrals that result in the probabilities used for sampling. The evaluation is different from what exists today - you need to specify a weighting to use so that both the training metrics and validation metrics are used in calculating the best model. The user can specify 0% or 100% to go with just the one measure of their choice as well. The function returns a list with data.table of the forecasts and prediction inverals and the other item in the list is the Performance Grid results so you can see how every model tested performed.
AutoBanditNNet()
Same as AutoBanditArima except it uses the forecast::nnetar model behind the scenes.
AutoTBATS()
AutoTBATS uses forecast::tbats behind the scenes. It just runs through all the parameter settings and builds each model and returns the same list as the other two above.
AutoETS()
AutoETS uses forecast::ets behind the scenes. It just runs through all the parameter settings and builds each model and returns the same list as the other two above.
AutoArfima()
AutoArfima uses forecast::arfima behind the scenes. It just runs through all the parameter settings and builds each model and returns the same list as the other two above.
AutoTS()
AutoTS()
Model Highlights
- Save model and xregs to file if a path is supplied
- Returns a list containing
- A data.table object with a date column and the forecasted values
- The model evaluation results
- The champion model for later use if desired
- The name of the champion model
- A time series ggplot with historical values and forecasted values with optional 80% and 95% prediction intervals
- The models tested internally include:
- DSHW: Double Seasonal Holt-Winters
- ARFIMA: Auto Regressive Fractional Integrated Moving Average
- ARIMA: Auto Regressive Integrated Moving Average with specified max lags, seasonal lags, moving averages, and seasonal moving averages
- ETS: Additive and Multiplicative Exponential Smoothing and Holt-Winters
- NNetar: Auto Regressive Neural Network models automatically compares models with 1 lag or 1 seasonal lag compared to models with up to N lags and N seasonal lags
- TBATS: Exponential smoothing state space model with Box-Cox transformation, ARMA errors, Trend and Seasonal components
- TSLM: Time Series Linear Model - builds a linear model with trend and season components extracted from the data
For each of the models tested internally, several aspects should be noted:
-
Optimal Box-Cox transformations are used in every run where data is strictly positive. The optimal transformation could also be "no transformation".
-
Four different treatments are tested for each model:
- user-specified time frequency + no historical series smoothing & imputation
- model-based time frequency + no historical smoothing and imputation
- user-specified time frequency + historical series smoothing & imputation
- model-based time frequency + historical smoothing & imputation
-
You can specify MaxFourierPairs to test out if adding Fourier term regressors can increase forecast accuracy. The Fourier terms will be applied to the ARIMA and NNetar models only.
-
For the ARIMA, ARFIMA, and TBATS, any number of lags and moving averages along with up to 1 seasonal lags and seasonal moving averages can be used (selection based on a stepwise procedure)
-
For the Double Seasonal Holt-Winters model, alpha, beta, gamma, omega, and phi are determined using least-squares and the forecasts are adjusted using an AR(1) model for the errors
-
The Exponential Smoothing State-Space model runs through an automatic selection of the error type, trend type, and season type, with the options being "none", "additive", and "multiplicative", along with testing of damped vs. non-damped trend (either additive or multiplicative), and alpha, beta, and phi are estimated
-
The neural network is setup to test out every combination of lags and seasonal lags and the model with the best holdout score is selected
-
The TBATS model utilizes any number of lags and moving averages for the errors, damped trend vs. non-damped trend are tested, trend vs. non-trend are also tested, and the model utilizes parallel processing for efficient run times
-
The TSLM model utilizes a simple time trend and season depending on the frequency of the data
Recommender Systems 

Expand to view content
AutoRecomDataCreate()
AutoRecomDataCreate() automatically creates your binary ratings matix from transaction data
AutoRecommender()
AutoRecommender() automated collaborative filtering modeling where each model below competes against one another for top performance
- RandomItems
- PopularItems
- UserBasedCF
- ItemBasedCF
- AssociationRules
AutoRecommenderScoring()
AutoRecommenderScoring() automatically score a recommender model from AutoRecommender()
AutoMarketBasketModel()
AutoMarketBasketModel() is a function that runs a market basket analysis automatically. It will convert your data, run the algorithm, and generate the recommended items. On top of that, it includes additional significance values not provided by the source pacakge.
Unsupervised Learning 

Expand to view content
ResidualOutliers()
ResidualOutliers() Generate residual outliers from time series modeling. (Cross with Feature Engineering) Utilize tsoutliers to indicate outliers within a time series data set
GenTSAnomVars()
GenTSAnomVars() generates time series anomaly variables. (Cross with Feature Engineering) Create indicator variables (high, low) along with cumulative anomaly rates (high, low) based on control limits methodology over a max of two grouping variables and a date variable (effectively a rolling GLM).

Database Management 

Expand to view content
AutoDataDictionary()
AutoDataDictionary() will pull back data dictionary data from a sql server data warehouse and run queries to pull in data to R. There are several data dictionary types that can be returned, such as returning every table that exists along with every column with metadata information. Another good one is to pull back all tables and their counterparts that can be used in joins, along with the joining sql.
SQL_Server_DBConnection()
SQL_Server_DBConnection() Create a connect with sql server
SQL_Query_Push()
SQL_Query_Push() Push data to a sql server warehouse
SQL_Query()
SQL_Query() Query a sql server table
SQL_ClearTable()
SQL_ClearTable() Deletes all rows of a sql server table
SQL_DropTable()
SQL_DropTable() Removes a sql server table
SQL_SaveTable()
SQL_SaveTable() Write a sql server table
SQL_UpdateTable()
SQL_UpdateTable() Update a sql server table
SQL_Server_BulkPull()
SQL_Server_BulkPull() Query a sql server table using bulk copy process
SQL_Server_BulkPush()
SQL_Server_BulkPush() Write to a sql server table using bulk copy process
Utilities, EDA, and Misc. 

Expand to view content
AutoWordFreq()
AutoWordFreq() creates a word frequency data.table and a word cloud

ProblematicFeatures()
ProblematicFeatures() identifies columns that have either little to no variance, categorical variables with extremely high cardinality, too many NA's, too many zeros, or too high of a skew.
RemixTheme()
RemixTheme() is a specific font, set of colors, and style for plots.
ChartTheme()
ChartTheme() is a specific font, set of colors, and style for plots.
multiplot()
multiplot() is useful for displaying multiple plots in a single pane. I've never had luck using grid so I just use this instead.
FakeDataGenerator()
FakeDataGenerator() I use this to create fake data for the examples in the function help files