SandDance
Visually explore, understand, and present your data.
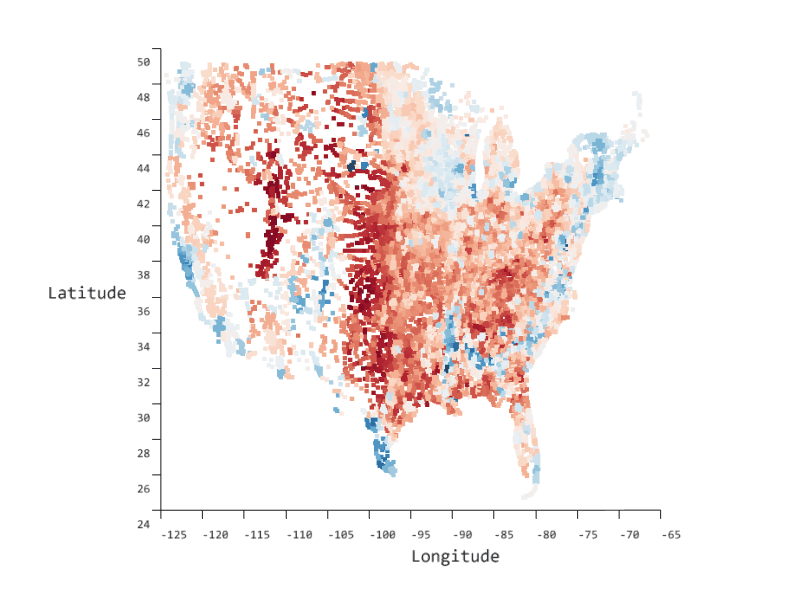
By using easy-to-understand views, SandDance helps you find insights about your data, which in turn help you tell stories supported by data, build cases based on evidence, test hypotheses, dig deeper into surface explanations, support decisions for purchases, or relate data into a wider, real world context.
SandDance uses unit visualizations, which apply a one-to-one mapping between rows in your database and marks on the screen. Smooth animated transitions between views help you to maintain context as you interact with your data.
This new version of SandDance has been rebuilt from scratch with the goal of being modular, extensible, and embeddable into your custom applications. We are now on GitHub so that we are open and driven by the community through contributions, feature requests, and discussion.
SandDance was created by the Microsoft Research VIDA Group which explores novel technologies for visualization and immersive data analytics.
Where can I use SandDance?
- Try it now on the web
- Microsoft apps:
- 3rd Party apps:
- In your own JavaScript apps - see below
Component architecture
SandDance is an offering of several JavaScript components:
- sanddance - the core SandDance visualization canvas.
- sanddance-react - the core SandDance visualization canvas for use in React based applications.
- sanddance-vue - the core SandDance visualization canvas for use in Vue based applications.
- sanddance-explorer - the core SandDance visualization canvas with UI to enable data exploration, for use in React based applications.
Publications
- 2018 - Atom: A Grammar for Unit Visualizations
- Deokgun Park, Steven Drucker, Roland Fernandez, Niklas Elmqvist
- IEEE Transactions on Visualization and Computer Graphics | December 2018, Vol 24(12): pp. 3032-3043
- 2015 - A Unifying Framework for Animated and Interactive Unit Visualizations
- Steven Drucker, Roland Fernandez
- MSR-TR-2015-65 | August 2015
Articles & videos
- SandDance project @ Microsoft Research
- Microsoft Research webinar / Data Visualization: Bridging the Gap Between Users and Information.
- SQL Server Blog / The August release of Azure Data Studio is now available
- Open Source Blog / What’s new in SandDance 3
- Channel 9 - Data Exposed / Introducing SandDance: Data Visualization in Azure Data Studio
- Channel 9 - Data Exposed / What is SandDance?
- Hacker News / Microsoft open sources SandDance, a visual data exploration tool
- analyticsindiamag.com / Visualizations With SandDance Using Visual Studio Code
- codeburst.io / Exploring Titanic Dataset using Microsoft’s Sandance
- mathkuro.com / VS Codeのイケメンすぎる分析&可視化ツールSand Danceの使い方
- mathkuro.com / 【SandDanceグラフサンプル】用途に合わせて選択しましょう◎
- medium.com - @sefaoguzsaglam / how to start data visualizing with Microsoft’s SandDance (for beginners)
- mssqltips.com / SandDance for Azure Data Studio
- sqlshack.com / Exploring the SandDance Visualizations extension in Azure Data Studio
- torbjornzetterlund.com / I got to do some SandDance visualization
- YouTube - Anjani Prasad Atluri / SandDance: A tutorial
- YouTube - BI Tracks / SandDance Visualizations Tutorial - Azure Data Studio
Changelog
- June 2020 - Major version bump to v3: Now using Deck.gl@8.
- December 2019 - Major version bump to v2: Now using Vega@5.
- August 2019 - Initial release to AppSource (Power BI marketplace).
- April 2019 - Initial release to GitHub.
Known issues
- Animations require a WebGL2 enabled browser.
Roadmap
PowerBI custom visual based on this new architecture.done!Additional views, such as stacks.done!- Code examples and tutorials.
Faceting for all chart types.done!- Better date handling.
Dependencies
SandDance is created with open source libraries, using Vega for chart layout and Deck.gl for WebGL rendering.
Development
See dev.md
Contributing
This project welcomes contributions and suggestions. Most contributions require you to agree to a Contributor License Agreement (CLA) declaring that you have the right to, and actually do, grant us the rights to use your contribution. For details, visit https://cla.microsoft.com.
When you submit a pull request, a CLA-bot will automatically determine whether you need to provide a CLA and decorate the PR appropriately (e.g., label, comment). Simply follow the instructions provided by the bot. You will only need to do this once across all repos using our CLA.
This project has adopted the Microsoft Open Source Code of Conduct. For more information see the Code of Conduct FAQ or contact [email protected] with any additional questions or comments.