expectocode / Telegram Analysis
Programming Languages
Projects that are alternatives of or similar to Telegram Analysis
telegram-analysis: Analyse Telegram chat logs easily
A tool for working with the output of telegram-history-dump
Examples
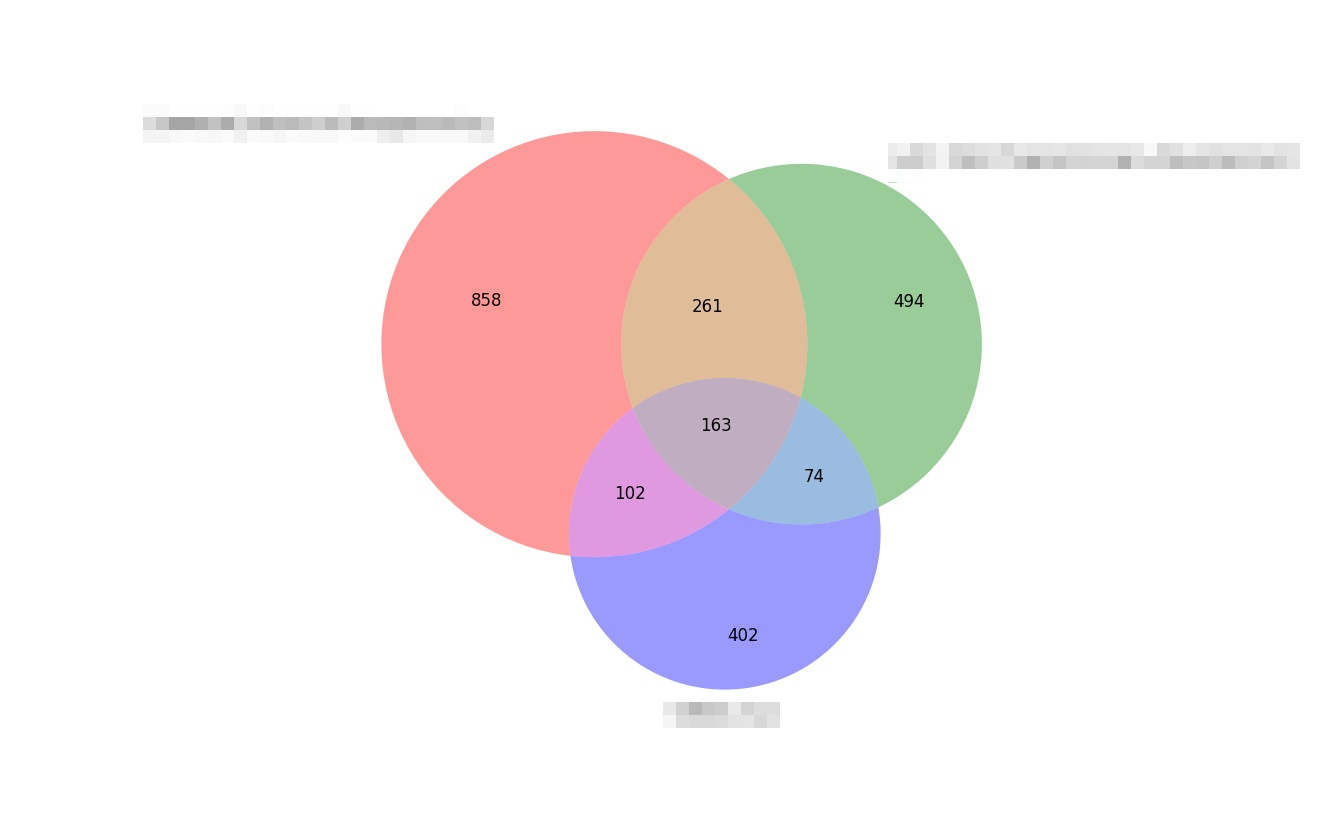
venn_userlist.py: compare user overlap between chats
activityovertime.py: compare activity in different chats through time

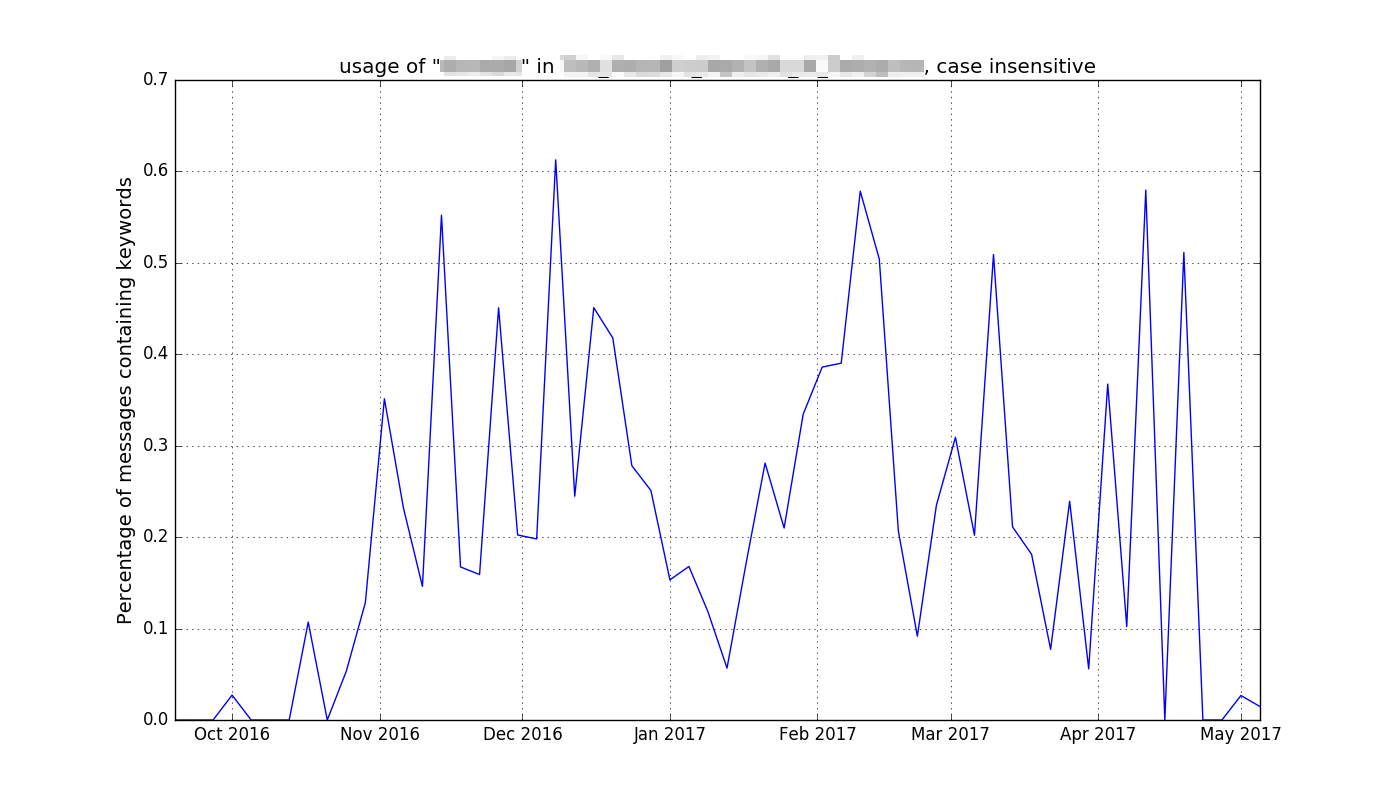
phraseovertime.py: compare popularity of different phrases in a chat through time
mostactiveusers.py: find who contributed the most to a chat

Installation (Linux)
Getting data
First, you need some data! To get this, you must install telegram-cli and telegram-history-dump. They both have install instructions but I'll give a short version here:
-
To install telegram-cli, first check your distro repos. If you're lucky, it'll be in there. If not, you'll have to compile from source.
git clone --recursivethe repo, install dependencies (listed in the readme),./configure,make,sudo make install. -
To install telegram-history-dump, clone the repo, ensure your ruby is version 2+, and you should be set.
Next, I suggest editing the telegram-history-dump config.yaml chat sections (near the top of the file) with the names of the chats you want to get chatlogs of to start with, and putting 'null' in any empty chat sections. As chatlogs can take a while to download, you might want to start with just a couple of them. It's full of explanatory comments, so this shouldn't be too difficult. The rest of the config has some sensible defaults, and it's probably not worth changing them at this point. Another thing to keep in mind when writing the config file is that if you're putting in chat names, make sure there are no commas or square brackets in them. (Also, consider using chat_ids instead of names, as names can change).
Then, run telegram-cli with no commandline arguments and set it up with your account - just a case of putting in your phone number and an auth code. Once that's set up, run telegram-cli --json -P 9009 and leave that terminal open. In another terminal, run the telegram-history-dump.rb script (it'll be in the folder where you cloned telegram-history-dump) and it'll start downloading your chatlogs.
Installing telegram-analysis
- Clone the repo.
- Make sure you have Python 3 installed by running
python3. If you don't have it, install Python 3 using your distro repos or the official site. - If you want to use any of the graphical scripts, you need matplotlib. This will probably be in your distro repos as
python-matplotlib, but you can also install with pip or from source. If you need more guidance, check out the official site. - If you want to make venn diagrams, you need
matplotlib-venn, which can be installed using pip. Check out the github repo for more information.
Once you have these things, you should be able to run all the analysis scripts!
Usage Guide
To start with, I recommend putting your json chatlogs in a folder with the scripts, so that your /path/to/chatlog.jsonl won't be a mess of relative path shenanigans. You can do this with the dumper's config.yaml file or by copying the files (the first is better long-term in my opinion).
I recommend using the -h/--help option on all the scripts rather than reading this quick run-through of the scripts, as the help text will be more detailed and correct for your version.
-
Get all the text from a chat and print to standard output (one line per message):
./getalltext.py /path/to/chatlog.jsonl -
Get all the text in a chat by a particular user and print to standard output (one line per message):
./getalltextfromuser.py /path/to/chatlog.jsonl username_without_at_sign -
Get all the text from a chat, and dump it into a text file:
./getalltext.py /path/to/chatlog.jsonl > somefile.txt -
You can combine a text-dumping with
mostcommonphrases.pyto get a list of the most commonly sent messages and their frequencies. For example, find what messages a user sends most often in a particular chat:./getalltextfromuser.py /path/to/chatlog.jsonl username_without_at_sign | ./mostcommonphrases.py[['lol', 110], ['hmm', 68], ['hey', 23], etc etc] -
Get a pie chart of the most active users in a chat:
./mostactiveusers.py -f /path/to/chatlog.jsonl -
Get a graph of the usage of a particular phrase or phrases in a chat over time:
./phraseovertime.py -f /path/to/chatlog.jsonl -p "phrase1" "phrase2" -
Get a graph of the activity levels of a chat or chats over time:
./activityovertime.py -f /path/to/chatlog1.jsonl /path/to/chatlog2.jsonl -
Same as above, but instead of opening a window with the graph, save the graph as an image in a folder:
./activityovertime.py -o /output/folder/ -f /path/to/chatlog1.jsonl /path/to/chatlog2.jsonl -
The same -o or --output-folder argument can be passed to
activityovertime,phraseovertime, andmostactiveusers. This allows, for example, scripting these so that you run them on every chat and save all the outputs to a certain directory:for file in json/*; do ./mostactiveusers.py --output-folder figures/ --file $file -
Find a rough percentage of users in a chat who send less than 3 messages:
./inactiveusers.py /path/to/chatlog.jsonl
Note that this script outputs a number which could be taken as a member-count of a chat, but is not, because the chatlogs have no data about people leaving a chat.
- Make a venn diagram showing the user overlap between two or three chats from chatlogs of those chats:
./venn_chatlog.py -f /path/to/chatlog1.jsonl /path/to/chatlog2.jsonl
Note that this script, due to a lack of data about people leaving in the chatlogs, will use a userlist of people who have ever been in a chat, not the actual current membership of a chat.
- Make a venn diagram showing the user overlap (of current membership) between two or three chats:
./venn_userlist.py -f /path/to/memberlist.json -c "Chat Name 1" "Chat Name 2"
This script gives more accurate venn diagrams, but uses data which is not easy to get. The script to get this data might become open source in the future.
-
Get a list of the chats you have userlists of:
./listchatsinmemberlist.py /path/to/memberlist.json -
Graph the growth of a chat over time:
./usersovertime.py /path/to/chatlog.jsonl
Thanks to NotAFile for writing this one.
Note that as with other scripts that use chatlogs for member counts, this one has no ability to see users leaving, so the numbers will be wrong if you use it for that.
Donations
If you like the project and have some bitcoin lying around, you're very welcome to send some to me here:
1FaMHTtEKHg8tVbdzCuy1VkRdSVpssJu17