twelvedata / Twelvedata Python
Programming Languages
Projects that are alternatives of or similar to Twelvedata Python
![]()


![]()
![]()
Twelve Data Python Client for APIs & WebSockets
Official python library for Twelve Data. This package supports all main features of the service:
- Get stock, forex and cryptocurrency OHLC time series.
- Get over 100+ technical indicators.
- Output data as:
json,csv,pandas - Full support for static and dynamic charts.
- Real-time WebSockets data stream.
Free API Key is required. It might be requested here
Installation
Use the package manager pip to install Twelve Data API library (without optional dependencies):
pip install twelvedata
Or install with pandas support:
pip install twelvedata[pandas]
Or install with pandas, matplotlib and plotly support used for charting:
pip install twelvedata[pandas,matplotlib,plotly]
Usage
Supported parameters
| Parameter | Description | Type | Required |
|---|---|---|---|
| symbol | stock ticker (e.g. AAPL, MSFT); physical currency pair (e.g. EUR/USD, CNY/JPY); digital currency pair (BTC/USD, XRP/ETH) |
string | yes |
| interval | time frame: 1min, 5min, 15min, 30min, 45min, 1h, 2h, 4h, 8h, 1day, 1week, 1month | string | yes |
| apikey | your personal API Key, if you don't have one - get it here | string | yes |
| exchange | if symbol is traded in multiple exchanges specify the desired one, valid for both stocks and cryptocurrencies | string | no |
| country | if symbol is traded in multiple countries specify the desired one, valid for stocks | string | no |
| outputsize | number of data points to retrieve | int | no |
| timezone | timezone at which output datetime will be displayed, supports: UTC, Exchange or according to IANA Time Zone Database |
string | no |
| start_date | start date and time of sampling period, accepts yyyy-MM-dd or yyyy-MM-dd hh:mm:ss format |
string | no |
| end_date | end date and time of sampling period, accepts yyyy-MM-dd or yyyy-MM-dd hh:mm:ss format |
string | no |
| order | sorting order of the time series output, supports desc or asc
|
string | no |
The basis for all methods is the TDClient object that takes the required apikey parameter.
Time series
-
TDClient.time_series()accepts all common parameters. Time series may be converted to several formats:-
ts.as_json()- will return JSON array -
ts.as_csv()- will return CSV with header -
ts.as_pandas()- will return pandas.DataFrame
-
from twelvedata import TDClient
# Initialize client - apikey parameter is requiered
td = TDClient(apikey="YOUR_API_KEY_HERE")
# Construct the necessary time serie
ts = td.time_series(
    symbol="AAPL",
    interval="1min",
    outputsize=10,
    timezone="America/New_York",
)
# Returns pandas.DataFrame
ts.as_pandas()
Technical indicators
This Python library supports all indicators implemented by Twelve Data. Full list of 100+ technical indicators may be found in API Documentation.
- Technical indicators are part of
TDClient.time_series()object. - It shares the universal format
TDClient.time_series().with_{Technical Indicator Name}, e.g..with_bbands(),.with_percent_b(),.with_macd() - Indicator object accepts all parameters according to its specification in API Documentation, e.g.
.with_bbands()accepts:series_type,time_period,sd,ma_type. If parameter is not provided it will be set to default value. - Indicators may be used in arbitrary order and conjugated, e.g.
TDClient.time_series().with_aroon().with_adx().with_ema() - By default, technical indicator will output with OHLC values. If you do not need OHLC, specify
TDClient.time_series().without_ohlc()
from twelvedata import TDClient

td = TDClient(apikey="YOUR_API_KEY_HERE")
ts = td.time_series(
    symbol="ETH/BTC",
    exchange="Huobi",
    interval="5min",
    outputsize=22,
    timezone="America/New_York",
)
# Returns: OHLC, BBANDS(close, 20, 2, EMA), PLUS_DI(9), WMA(20), WMA(40)
ts.with_bbands(ma_type="EMA").with_plus_di().with_wma(time_period=20).with_wma(time_period=40).as_pandas()

# Returns: STOCH(14, 1, 3, SMA, SMA), TSF(close, 9)
ts.without_ohlc().with_stoch().with_tsf().as_json()
Batch requests
With batch requests up to 120 symbols might be returned per single API call. There are two options on how to do this:
# 1. Pass instruments symbols as a string delimited by comma (,)
ts = td.time_series(
    symbol="V, RY, AUD/CAD, BTC/USD:Huobi"
)

# 2. Pass as a list of symbols
ts = td.time_series(
    symbol=["V", "RY", "AUD/CAD", "BTC/USD:Huobi"]
)
Important. Batch requests are only supported with .as_json() and .as_pandas() formats.
With .as_json() the output will be a dictionary with passed symbols as keys. The value will be a tuple with quotes, just the same as with a single request.
ts = td.time_series(symbol='AAPL,MSFT', interval="1min", outputsize=3)
df = ts.with_macd().with_macd(fast_period=10).with_stoch().as_json()

{
    "AAPL": ({'datetime': '2020-04-23 15:59:00', 'open': '275.23001', 'high': '275.25000', 'low': '274.92999', 'close': '275.01001', 'volume': '393317', 'macd_1': '-0.33538', 'macd_signal_1': '-0.24294', 'macd_hist_1': '-0.09244', 'macd_2': '-0.40894', 'macd_signal_2': '-0.29719', 'macd_hist_2': '-0.11175', 'slow_k': '4.52069', 'slow_d': '7.92871'}, {'datetime': '2020-04-23 15:58:00', 'open': '275.07001', 'high': '275.26999', 'low': '275.00000', 'close': '275.25000', 'volume': '177685', 'macd_1': '-0.31486', 'macd_signal_1': '-0.21983', 'macd_hist_1': '-0.09503', 'macd_2': '-0.38598', 'macd_signal_2': '-0.26925', 'macd_hist_2': '-0.11672', 'slow_k': '14.70578', 'slow_d': '6.82079'}, {'datetime': '2020-04-23 15:57:00', 'open': '275.07001', 'high': '275.16000', 'low': '275.00000', 'close': '275.07751', 'volume': '151169', 'macd_1': '-0.30852', 'macd_signal_1': '-0.19607', 'macd_hist_1': '-0.11245', 'macd_2': '-0.38293', 'macd_signal_2': '-0.24007', 'macd_hist_2': '-0.14286', 'slow_k': '4.55965', 'slow_d': '2.75237'}),
    "MSFT": ({'datetime': '2020-04-23 15:59:00', 'open': '171.59000', 'high': '171.64000', 'low': '171.22000', 'close': '171.42000', 'volume': '477631', 'macd_1': '-0.12756', 'macd_signal_1': '-0.10878', 'macd_hist_1': '-0.01878', 'macd_2': '-0.15109', 'macd_signal_2': '-0.12915', 'macd_hist_2': '-0.02193', 'slow_k': '20.95244', 'slow_d': '26.34919'}, {'datetime': '2020-04-23 15:58:00', 'open': '171.41000', 'high': '171.61000', 'low': '171.33501', 'close': '171.61000', 'volume': '209594', 'macd_1': '-0.12440', 'macd_signal_1': '-0.10408', 'macd_hist_1': '-0.02032', 'macd_2': '-0.14786', 'macd_signal_2': '-0.12367', 'macd_hist_2': '-0.02419', 'slow_k': '39.04785', 'slow_d': '23.80945'}, {'datetime': '2020-04-23 15:57:00', 'open': '171.34500', 'high': '171.48000', 'low': '171.25999', 'close': '171.39999', 'volume': '142450', 'macd_1': '-0.13791', 'macd_signal_1': '-0.09900', 'macd_hist_1': '-0.03891', 'macd_2': '-0.16800', 'macd_signal_2': '-0.11762', 'macd_hist_2': '-0.05037', 'slow_k': '19.04727', 'slow_d': '14.92063'})
}
With .as_pandas() the output will be a 3D DataFrame with MultiIndex for (symbol, datetime).
ts = td.time_series(symbol='AAPL,MSFT', interval="1min", outputsize=3)
df = ts.with_macd().with_macd(fast_period=10).with_stoch().as_pandas()

#                                open       high  ...    slow_k    slow_d
# AAPL 2020-04-23 15:59:00  275.23001  275.25000  ...   4.52069   7.92871
#      2020-04-23 15:58:00  275.07001  275.26999  ...  14.70578   6.82079
#      2020-04-23 15:57:00  275.07001  275.16000  ...   4.55965   2.75237
# MSFT 2020-04-23 15:59:00  171.59000  171.64000  ...  20.95244  26.34919
#      2020-04-23 15:58:00  171.41000  171.61000  ...  39.04785  23.80945
#      2020-04-23 15:57:00  171.34500  171.48000  ...  19.04727  14.92063
#
# [6 rows x 13 columns]

df.loc['AAPL']

#                           open       high  ...    slow_k   slow_d
# 2020-04-23 15:59:00  275.23001  275.25000  ...   4.52069  7.92871
# 2020-04-23 15:58:00  275.07001  275.26999  ...  14.70578  6.82079
# 2020-04-23 15:57:00  275.07001  275.16000  ...   4.55965  2.75237
#
# [3 rows x 13 columns]

df.columns

# Index(['open', 'high', 'low', 'close', 'volume', 'macd1', 'macd_signal1',
#        'macd_hist1', 'macd2', 'macd_signal2', 'macd_hist2', 'slow_k',
#        'slow_d'],
#       dtype='object')
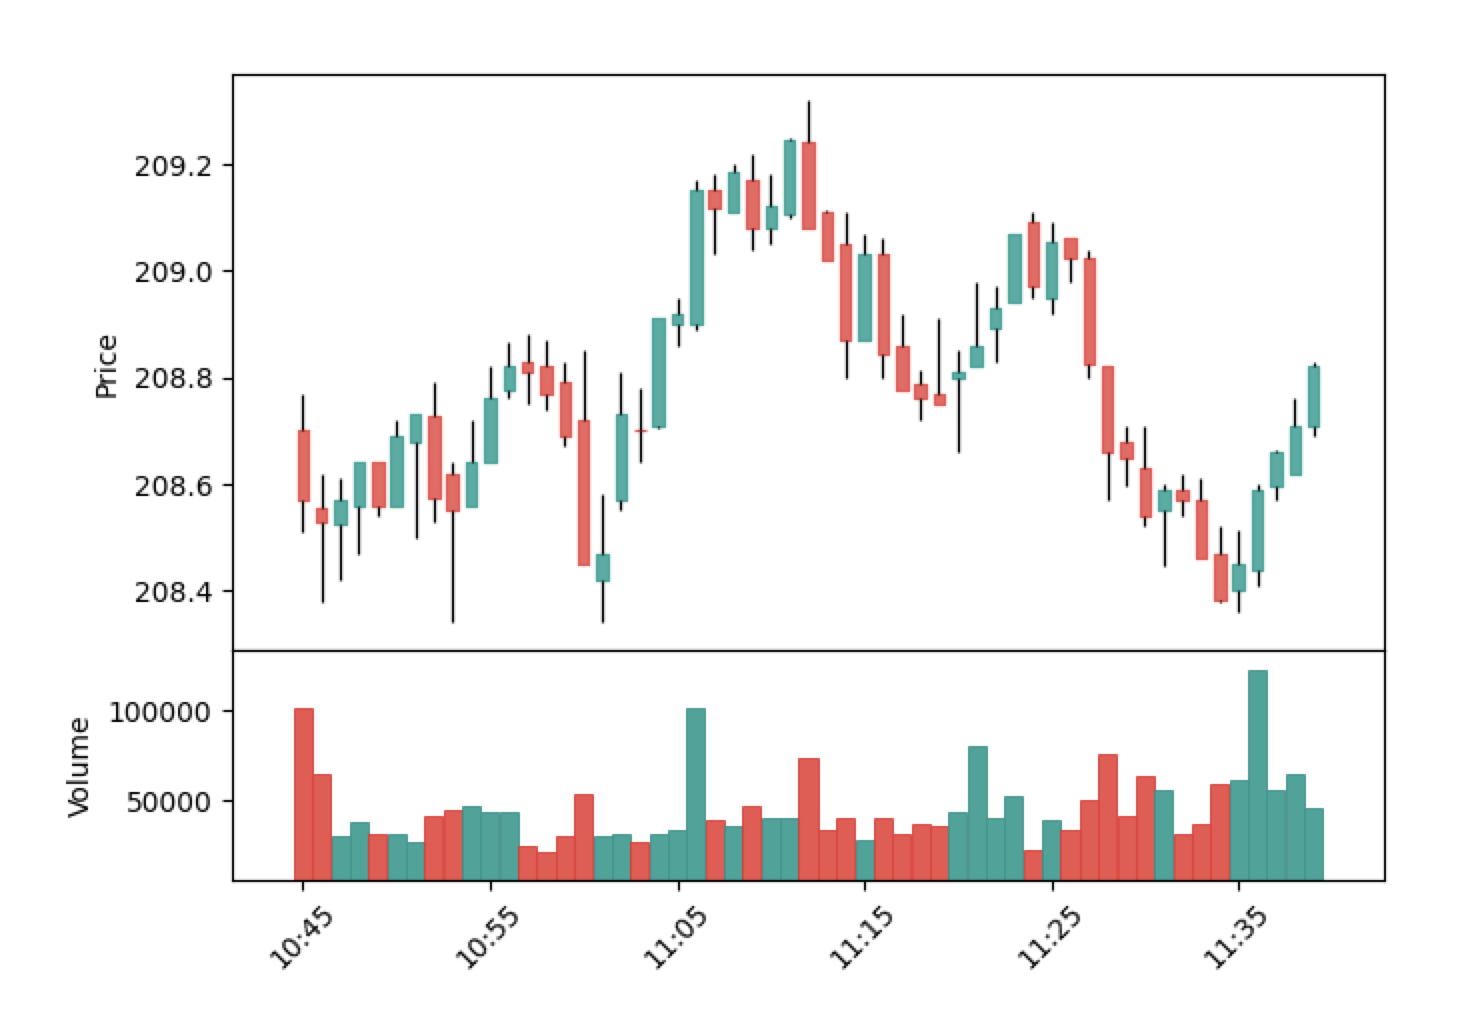
Charts
Charts support OHLC, technical indicators and custom bars.
Static
Static charts are based on matplotlib library and require mplfinance package to be installed.
- Use
.as_pyplot_figure()
from twelvedata import TDClient

td = TDClient(apikey="YOUR_API_KEY_HERE")
ts = td.time_series(
    symbol="MSFT",
    outputsize=75,
    interval="1day",
)
# 1. Returns OHLCV chart
ts.as_pyplot_figure()

# 2. Returns OHLCV + BBANDS(close, 20, 2, SMA) + %B(close, 20, 2 SMA) + STOCH(14, 3, 3, SMA, SMA)
ts.with_bbands().with_percent_b().with_stoch(slow_k_period=3).as_pyplot_figure()
Interactive
Interactive charts are built on top of plotly library.
- Use
.as_plotly_figure().show()
from twelvedata import TDClient

td = TDClient(apikey="YOUR_API_KEY_HERE")
ts = td.time_series(
    symbol="DNR",
    outputsize=50,
    interval="1week",
)
# 1. Returns OHLCV chart
ts.as_plotly_figure()

# 2. Returns OHLCV + EMA(close, 7) + MAMA(close, 0.5, 0.05) + MOM(close, 9) + MACD(close, 12, 26, 9)
ts.with_ema(time_period=7).with_mama().with_mom().with_macd().as_plotly_figure().show()
WebSocket
With the WebSocket, a duplex communication channel with the server is established.
Make sure to have websocket_client package installed.
Features
- Real-time low latency stream of financial quotes.
- You might subscribe to stocks, forex, and crypto.
Example
from twelvedata import TDClient

def on_event(e):
    # do whatever is needed with data
    print(e)

td = TDClient(apikey="YOUR_API_KEY_HERE")
ws = td.websocket(symbols="BTC/USD", on_event=on_event)
ws.subscribe(['ETH/BTC', 'AAPL'])
ws.connect()
ws.keep_alive()
Parameters accepted by the .websocket() object:
- symbols list of symbols to subscribe
- on_event function that invokes when event from server is received
- logger instance of logger, otherwise set to default
-
max_queue_size maximum size of queue, default
12000 -
log_level accepts
debugorinfo, otherwise not set
Applicable methods on .websocket() object:
-
ws.subscribe([list of symbols]): get data from the symbols passed -
ws.unsubscribe([list of symbols]): stop receiving data from the symbols passed -
ws.reset(): unsubscribe from all symbols -
ws.connect(): establish connection with WebSocket server -
ws.disconnect(): close connection with WebSocket server -
ws.keep_alive(): run connection forever until closed
Important. Do not forget that WebSockets are only available for Twelve Data Prime members.
Support
Visit our official website https://twelvedata.com or reach out to the Twelve Data team at [email protected].
Announcements
Follow @TwelveData on Twitter for announcements and updates about this library.
Roadmap
- [x] WebSocket
- [x] Batch requests
- [x] Custom plots coloring
- [x] Interactive charts (plotly)
- [x] Static charts (matplotlib)
- [x] Pandas support
Contributing
- Clone repo and create a new branch:
$ git checkout https://github.com/twelvedata/twelvedata -b name_for_new_branch. - Make changes and test.
- Submit Pull Request with comprehensive description of changes.
License
This package is open-sourced software licensed under the MIT license.